
Marine climatological study of four Canadian coastal regions
To access the full reports, please email us at f.ccds.info-info.dscc.f@ec.gc.ca.
On this page
- Introduction
- Study regions
- Frequency data analyses on wind and wave climatologies during 1950-2015
- Projected future changes in the marine climate elements
- Risks and impacts to the marine transportation industry
- Work cited
- Appendix 1: Extreme wave height indices
- Appendix 2: Extreme wind indices
Introduction
The Climate Research Division (CRD) received funds from the Meteorological Service of Canada (MSC) as part of the World Class Tanker Safety initiative to complete marine climatological studies for four port regions. These pilot regions were selected because they have a high volume of marine traffic. The purpose of the work was to contribute to Environment and Climate Change Canada's (ECCC) operational science capacity by providing knowledge of the climatology and sea state for the four regions including detailed frequency data, trend analysis and information on future projections of extreme wind, waves, and other climate elements of relevance in terms of threats posed to the marine transportation industry.
This information is intended to inform future operators and regulators of the likelihood of weather conditions in these areas that could cause risk to tankers, navigational systems, and shore-based infrastructure and which also could affect the fate and behaviour of a spill and a recovery operation. In November 2016, ECCC solicited competitive bids for the project titled “Climatological and Sea State Study for Four Area Response Plan Pilot Locations”. This competitive bid process was won by Amec Foster Wheeler based on the strength of the experience, knowledge, qualifications and technical proposal as assessed against the evaluation criteria (the financial aspects of the proposal were not evaluated by CRD).
The contractor delivered four detailed climatological reports (one covering each of the four Area Response Plan (ARP) pilot areas) that provided information on historical and possible future wind and wave climatology along with their assessment of key risks for the marine transportation industry related to changes in the relevant marine climate elements. Full reports are available in English only.
A brief description of the results are provided below. If you'd like access to a full report, please email us at f.ccds.info-info.dscc.f@ec.gc.ca.
Study regions
The four Area Response Plan (ARP) pilot areas include:
- Area 1: Southern portion of British Columbia
- Area 2: St. Lawrence (Montreal to Anticosti Island)
- Area 3: Saint John and the Bay of Fundy
- Area 4: Port Hawkesbury and the Strait of Canso
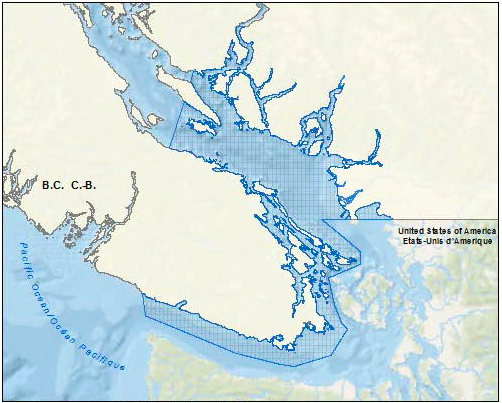
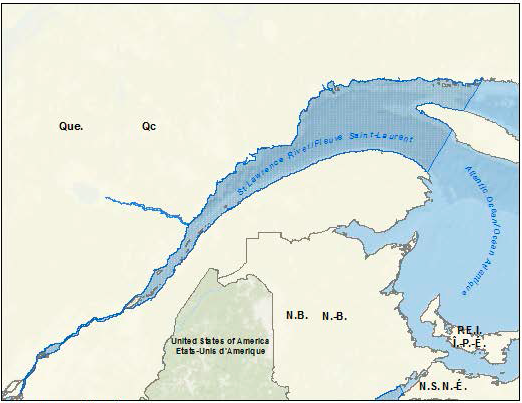

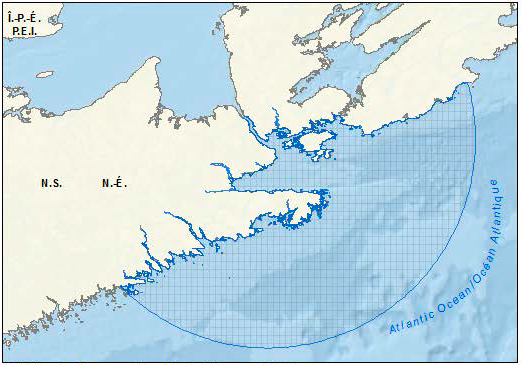
Long description
Maps showing the four Area Response Plan pilot areas. Top left image shows Area 1: Southern portion of British Columbia. Top right image shows Area 2: St. Lawrence (Montreal to Anticosti Island). Botton left image shows Area 3: Saint John and the Bay of Fundy. Botton right image shows Area 4: Port Hawkesbury and the Strait of Canso.
Frequency data analysis on wind and wave climatology, including extremes, and other relevant marine climate elements from 1950s to 2015
For use in evaluation of historical wind and wave conditions in each of the four ARPs, ECCC provided the contractor access to the MSC50 data for 1954-2015 in Areas 2-4, and OWI wave hindcast data for 1980-2015 in Area 1. The evaluation included (1) calculation of time series of monthly, seasonal and annual minimum, maximum and selected percentiles (7 statistics for 17 timeframes) for wind speed and wave height and (2) calculation of extreme wind and wave indices (see Appendices 1 and 2). Climatological mean values and linear trends were calculated for each of the wind and wave time series and the extreme indices and were provided as digital maps.
Over the period 1954-2015, a slight upward trend was found in median wave heights in Area 2, in minimum and median wave heights in Area 3, and in minimum, median and maximum wave heights in Area 4. There are no wave data available for the grid-points in Area 1. In the region west of Vancouver Island, the annual minimum, median and maximum wave heights were all found to have no significant trends over the period 1980-2015 but the frequency of rough wave days has been trending upward in recent decades.
Analysis of projected future changes in relevant marine climate elements
To assess projected future changes to surface winds and future wave heights for the four ARPs, the Statement of Work for the contract specified that the contractor use four CMIP5 models for two possible future emission scenarios (RCP4.5 and RCP8.5, representing intermediate and high future forcing from anthropogenic GHG emissions). The four climate models were selected to represent the range of model variability for waves as shown in a previous study (Wang et al. 2014Footnote 1) but the selection was also limited to the availability of surface wind data (some models do not output surface winds). The evaluation included (1) calculation of time series of monthly, seasonal and annual minimum, maximum and selected percentiles (7 statistics for 17 timeframes) for wind speed and wave height and (2) calculation of extreme wind and wave indices for three time slices (1986-2005, 2046-2065, 2081-2100). Digital maps showing projected future changes (2046-2065, 2081-2100 from 1986-2005) in the set of seasonal wind and wave statistics and extreme indices for the two RCPs were provided (shown as either multi-model mean, or minimum and maximum projected changes).
According to the four-model mean climate change projections, in the coming decades, maximum wave heights in the region west of Area 1 and the frequency of high wave days are projected to increase. The number of days with consecutive top-decile wave days is projected to increase slightly by the end of the century in Areas 3 and 4 but to decrease slightly in Area 2; wave heights in these areas are generally projected to decrease moderately or remain unchanged. Note that the results are limited to the four models analyzed and to their resolution (the wave data are on a 1x1 latitude-longitude grid). Higher resolution data are needed to improve this assessment but have not yet been generated.
Description of key risks and impacts for marine transportation industry related to changes in relevant marine climate elements for ARP pilot areas
For each of the four ARP pilot areas, the contractor provided a discussion of observed and projected changes in wind and wave climatology and potential impacts related to the marine transportation industry. It is important to note that the projections provided are from only four climate models. As such, the full range of potential future variability may not be captured by this limited ensemble. Additionally, the projections are at fairly coarse GCM-scale resolution; there is very limited wave data available for the grid-points shown in the Area maps. The uncertainty in the projections is large and likely not well represented by the small ensemble of four models. These factors must be considered when interpreting/using the results and data.
Appendix 1: Extreme wave height indices
| ID | Indicator name | Definition | Unit |
|---|---|---|---|
| HsMx | Monthly maximum wave height | Monthly maximum value of significant wave height (Hs) | m |
| HsAx | Annual maximum wave height | Annual maximum value of significant wave height (Hs) | m |
| HsRo | Rough wave days | Annual count of days when daily max Hs > 2.5 m | Days |
| HsHi | High wave days | Annual count of days when daily max Hs > 6 m | Days |
| fHsRo | Frequency of rough wave days | Annual percentage of days when daily max Hs > 2.5 m | % |
| fHsHi | Frequency of high wave days | Annual percentage of days when daily max Hs > 6 m | % |
| fHs90p | Frequency of top decile wave days | Annual percentage of days when daily max Hs > 90th percentile of base period (1986-2005) (all calendar days share the same percentiles) | % |
| fHs10p | Frequency of low decile wave days | Annual percentage of days when daily max Hs < 10th percentile of base period (1986-2005) (all calendar days share the same percentiles) | % |
| HHsDI | Top decile wave spell duration indicator | Annual count of days with at least 2 consecutive days when daily max Hs > 90th percentile of base period (1986-2005) (all calendar days share the same percentiles) | Days |
Appendix 2: Extreme wind indices
| ID | Indicator name | Definition | Unit |
|---|---|---|---|
| WsMx | Monthly maximum wind speed | Monthly maximum value of wind speed (Ws) | m/s |
| WsAx | Annual maximum wind speed | Annual maximum value of wind speed (Ws) | m/s |
| WsB0 | Calm wind days | Annual count of days when daily max Ws < 0.514 m/s (1 knot, Beaufort Scale 0) | days |
| WsB7 | Near gale-force wind days | Annual count of days when daily max Ws > 14.403 m/s (Beaufort Scale 7) | days |
| WsB8 | Gale-force wind days | Annual count of days when daily max Ws > 17.222 m/s (Beaufort Scale 8) | days |
| WsB9 | Strong gale-force wind days | Annual count of days when daily max Ws > 20.833 m/s (Beaufort Scale 9) | days |
| WsB10 | Storm-force wind days | Annual count of days when daily max Ws > 24.722 m/s (Beaufort Scale 10) | days |
| fWsB0 | Frequency of calm wind days | Annual percentage of days when daily max Ws < 0.514 m/s (1 knot, Beaufort Scale 0) | % |
| fWsB7 | Frequency of near gale-force wind days | Annual percentage of days when daily max Ws > 14.403 m/s (Beaufort Scale 7) | % |
| fWsB8 | Frequency of gale-force wind days | Annual percentage of days when daily max Ws > 17.222 m/s (Beaufort Scale 8) | % |
| fWsB9 | Frequency of strong gale-force wind days | Annual percentage of days when daily max Ws > 20.833 m/s (Beaufort Scale 9) | % |
| fWsB10 | Frequency of storm-force wind days | Annual percentage of days when daily max Ws > 24.722 m/s (Beaufort Scale 10) | % |
| fWs90p | Frequency of top decile wind days | Annual percentage of days when daily max Ws > 90th percentile of base period (1986-2005) (all calendar days share the same percentiles) | % |
| fWs10p | Frequency of low decile wind days | Annual percentage of days when daily max Ws < 10th percentile of base period (1986-2005) (all calendar days share the same percentiles) | % |
| HWsDI | Top decile wind spell duration indicator | Annual count of days with at least 2 consecutive days when daily max Ws > 90th percentile of base period (1986-2005) (all calendar days share the same percentiles) | days |
| LWsDI | Low decile wind spell duration indicator | Annual count of days with at least 2 consecutive days when daily max Ws < 10th percentile of base period (1986-2005) (all calendar days share the same percentiles) | days |