
CMIP6 and Shared Socio-economic Pathways overview
On this page
- The Coupled Model Intercomparison Project (CMIP) and the Intergovernmental Panel on Climate Change (IPCC)
- Coupled Model Intercomparison Project Phase 6 (CMIP6)
- Shared Socio-economic Pathways (SSPs)
- CMIP5 versus CMIP6
- References
The Coupled Model Intercomparison Project (CMIP) and the Intergovernmental Panel on Climate Change (IPCC)
There are currently dozens of climate modelling institutions around the world, each producing its own climate model. Individual climate models are developed and improved over decades as each organization's team of scientists attempts to replicate global climatic processes with as much accuracy as possible. Some modelling centres focus a bit more on certain processes or regions (such as tropical variability and monsoons, or polar climate and sea-ice), and their results, published in the scientific literature, inform all modelling groups.
Every five to seven years, the international climate modelling community comes together to use the latest versions of their climate models in a coordinated suite of model simulations. The result of this model intercomparison is that the climate science community can assess how well the models perform compared to previous versions of models and against other new models. In addition, the resulting ensemble of model results support a wide range of climate change impact and adaptation studies and programs, and public education and outreach. An ensemble of models following a standard experimental framework allows scientists to compute ensemble statistics (e.g., averages) across the suite of models. This leads to more robust projections than those produced by any individual model, and also allows quantification of confidence or uncertainty in those projections. This highly successful global collaboration is known as the Coupled Model Intercomparison Project (CMIP).
The outcomes of a CMIP, including the findings reported, published, and peer-reviewed by the participating groups and scientists, contribute to assessments and reports produced by the Intergovernmental Panel on Climate Change (IPCC). The IPCC is the intergovernmental body of the United Nations (UN) tasked with regularly assessing the science related to the Earth’s changing climate and determining the state of knowledge related to climate change. The IPCC does not conduct its own research, rather scientists from around the world conduct comprehensive assessments of peer-reviewed scientific literature published each year. Therefore, IPCC Assessment Reports (ARs), the largest and most comprehensive reports produced by the IPCC, make extensive use of the large body of research and latest model data produced by a CMIP.
Coupled Model Intercomparison Project Phase 6 (CMIP6)
The Sixth Phase of the Coupled Model Intercomparison Project (CMIP6) was organized by the World Climate Research Programme (WCRP).Reference1 The WCRP coordinates the efforts of partners and modelling groups participating in CMIP. Over time, as participation in CMIP increased and the number and complexity of climate models expanded, the need for increasingly detailed and organized experiments led to CMIP becoming an integrated framework within which a number of individual Model Intercomparison Projects (MIPs) are organized. MIPs are sets of experiments and simulations designed to test and compare specific aspects of climate models. Each individual MIP lays out an experimental design aimed at improving understanding of:
- important physical processes in the climate system; or
- the response of the climate system to external drivers (such as increasing greenhouse gases).
CMIP6 comprises 23 individual MIPs. Future climate change simulations are coordinated within ‘ScenarioMIP’ for which approximately 30 climate models contributed results.Reference5 Additionally, the Diagnostic, Evaluation and Characterization of Klima (DECK) experiments are central to CMIP6 as they involve the historical simulations (1850–near present) that allow evaluation of the model’s simulation of past climate. While MIPs are given priority by CMIP, and organizations can participate in as many or few as they are able, the DECK experiments are mandatory for any model to enter into the CMIP. The schematic below illustrates the complex and interconnected nature of CMIP6.

Figure 1. CMIP6 experimental organization.Reference1 The DECK experiments and surrounding inner ring demonstrate the foundational nature of the historical simulations within the CMIP6 framework. Shown in the outer ring are some of the CMIP6 MIPs which attempt to address the topics displayed in the middle ring.
Long description
Figure 1 depicts the CMIP6 experimental organization as a series of labelled concentric rings. The centre and innermost rings are previously mentioned DECK experiments and CMIP6 historical simulations, respectively, demonstrating the foundational nature of these experiments within the CMIP6 framework. The next ring describes the focus of CMIP6 on common structure and mechanisms for model outputs and ensembles produced for the CMIP6: common standards, coordination, infrastructure, and documentation. The following ring is labelled with a series of topics that relate back to the three broad questions the CMIP6 experiments aim to address within the Grand Science Challenges of the WCRP:
- How does the Earth system respond to forcing?
- What are the origins and consequences of systematic model biases?
- How can we assess future climate changes given internal climate variability, predictability, and uncertainties in scenarios?
Shared Socio-economic Pathways (SSPs)
The latest iteration of scenarios, used for CMIP6 (2016-2021) and featured in the IPCC Sixth Assessment Report (AR6) (2021), are based on a set of Shared Socio-economic Pathways (SSPs).Reference3 The SSP-based scenarios are the most complex created to date and span a range from very ambitious mitigation to ongoing growth in emissions. The most ambitious mitigation scenario was specifically designed to align with the low end of the Paris Agreement global temperature goal of holding the increase in global temperature to well below 2°C above pre-industrial levels, and pursuing efforts to limit the increase to 1.5°C. SSP-based scenarios combine elements from the new narratives about future societal development (the SSPs) with the previous iteration of scenarios, the Representative Concentration Pathways (RPCs), which describe trajectories of change in atmospheric GHG and aerosol concentrations (and corresponding changes in radiative forcing) over time. The SSPs represent alternative storylines about how the world might develop over the coming century in the absence of climate policy (see Table 1 below). The SSPs describe plausible narratives of global societal developments in the future without considering climate change, or mitigation or adaptation responses. So while they do not on their own quantify an adaptation or mitigation dimension, they do reflect the difficulty and associated successes or challenges of implementing mitigation or adaptation strategies based on societal features such as population size, extent of regional collaboration, technological developments etc. Five SSPs were created, with varying assumptions about human developments including: population, education, urbanization, gross domestic product (GDP), economic growth, rate of technological developments, greenhouse gas (GHG) and aerosol emissions, energy supply and demand, land-use changes, etc. The SSPs were designed to work in combination with an updated version of the RCPs.Reference6 The new RCPs define the stabilized radiative forcings (the difference between incoming solar radiation from the sun, and outgoing energy radiated back into space by Earth) at the end of the century and therefore, the level of climate change policy required for a particular SSP to reach said forcing.
The SSPs are labelled SSP1 through SSP5. The following table below provides a brief overview of each of the five scenario narratives.Reference6
Table 1. Overview of SSP scenarios.Reference6
SSP1 |
Sustainability - Taking the green road (low challenges to mitigation and adaptation)
|
SSP2 |
Middle of the road - (medium challenges to mitigation and adaptation)
|
SSP3 |
Regional rivalry - A rocky road (high challenges to mitigation and adaptation)
|
SSP4 |
Inequality - A road divided (low challenges to mitigation, high challenges to adaptation)
|
SSP5 |
Fossil-fueled development - Taking the highway (high challenges to mitigation, low challenges to adaptation)
|
Each SSP drives a corresponding future projection of greenhouse gas emissions and land-use change under the baseline SSP storyline. As previously mentioned, SSPs were designed to function in combination with a new and improved version of RCPs. In this way, different climate policy futures can be superimposed on SSPs to represent the influence of different climate policy choices (e.g. switching to renewable energy from fossil fuels) and the ease or difficulty in reaching the end-of-century radiative forcing goal specified by an RCP. The different policy scenarios lead to different levels of radiative forcing (a measure of the extent to which GHGs in the atmosphere warm or cool the climate, measured in watts per meter squared (W/m2)) by the year 2100 and range from 1.9 to 8.5 W/m2 with higher values representing stronger climate warming effects. The particular forcing values were chosen to allow easy comparison of the new scenarios to the RCPs used in the CMIP5 and IPCC AR5. Not all possible combinations of SSPs and forcing scenarios are viable and therefore, some do not have simulations. For example, SSP5 which prioritizes fossil-fuel development, thereby establishing a world with high emissions, is incompatible with a low forcing scenario (e.g. 1.9 W/m2), which would require stricter climate policy and strong mitigation, and therefore low greenhouse gas emissions.
Possible combinations are shown in Figure 2, along with the corresponding RCPs. The high number of possible scenarios, shown as boxes of any colour, led ScenarioMIP to designate levels of priority to certain scenarios for modelling organizations. Four scenarios were designated as ‘Tier 1’ (blue) scenarios and considered the top priority in the ScenarioMIP experimental design. These Tier 1 scenarios span a broad range of uncertainty in future socio-economic and climate forcing pathways and serve as good comparisons to RCP2.6, RCP4.5, RCP6.0, and RCP8.5 scenarios used for CMIP5. The ‘Tier 2’ (yellow) scenarios include additional scenarios of interest for modelling centres to explore if resources allowed.
The following two figures provide visualizations to demonstrate how the baseline SSPs differ in terms of socio-economic characteristics (Figure 3) and greenhouse gas emissions and land-use (Figure 4).
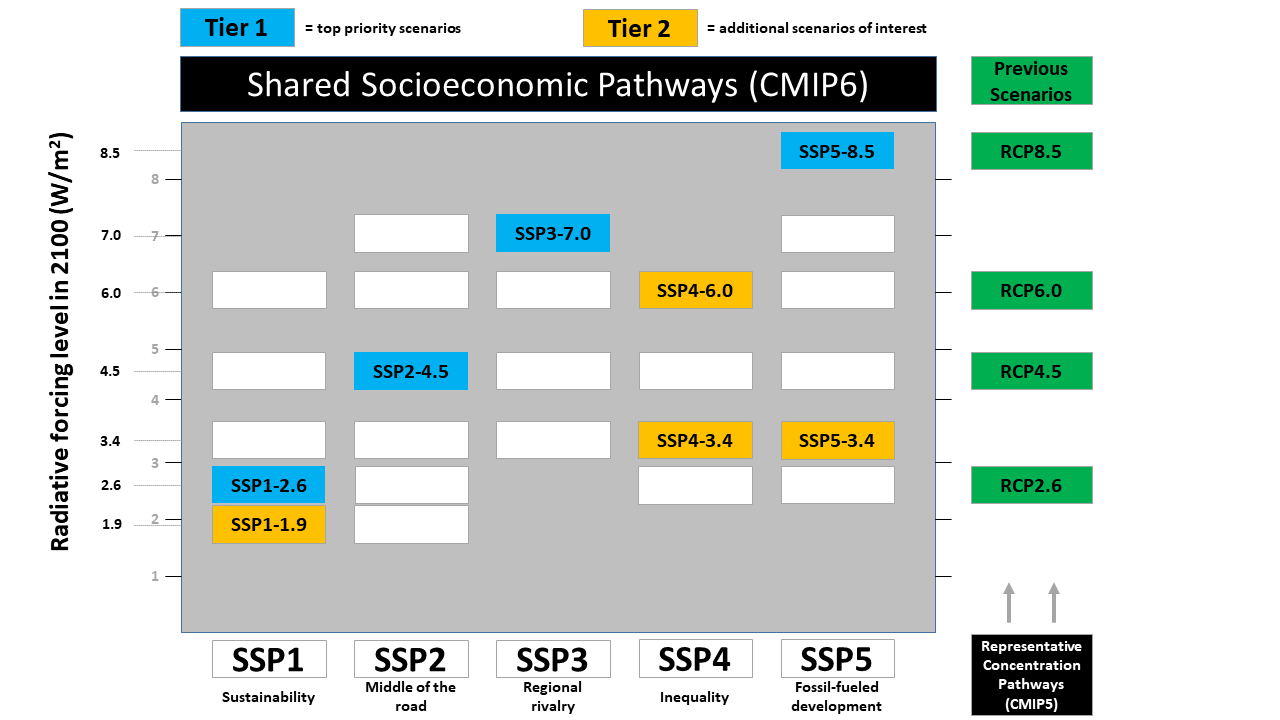
Figure 2. Shared Socio-economic Pathways and year 2100 radiative forcing combinations used in ScenarioMIP.Reference5
Long description
Figure 2 is a matrix depicting all possible SSP and radiative forcing combinations, colour-coded to show the priority of each scenario. Tier 1, or top priority, scenarios are SSP1-2.6, SSP2-4.5, SSP3-7.0, and SSP5-8.5. Three of the four Tier 1 scenarios are updated versions of previous CMIP5 RCP scenarios (RCP2.6, RCP4.5, and RCP8.5) to allow for ease of comparison between CMIP5 and CMIP6 projections. Tier 2 scenarios are SSP1-1.9, SSP4-6.0, SSP4-3.4, and SSP5-3.4. All other SSP and radiative forcing combinations are either not viable or, not designated as a priority by ScenarioMIP and, therefore, not included.
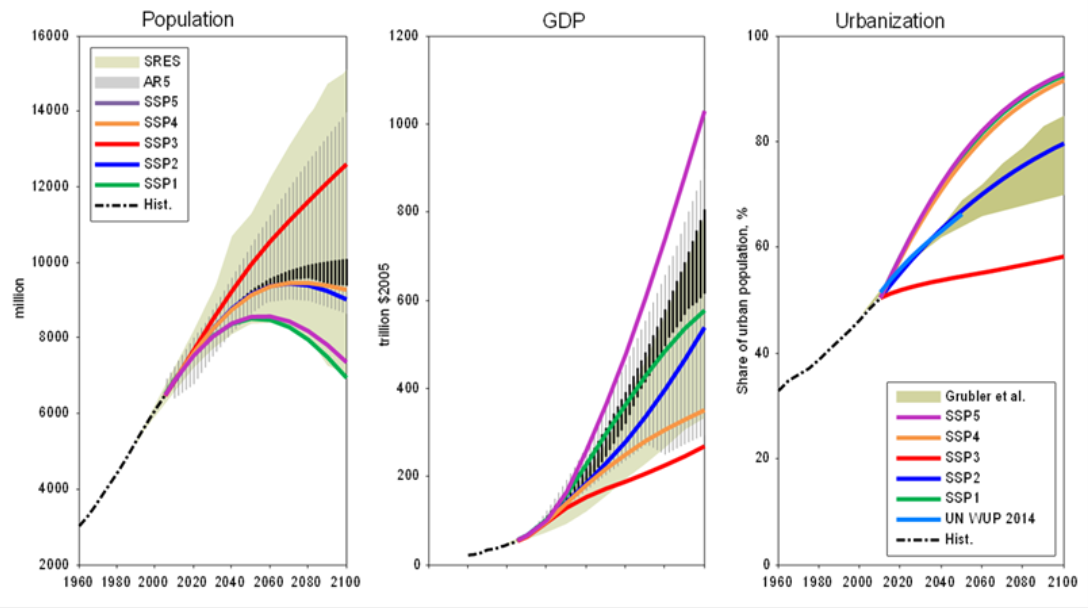
Figure 3. Differences in the projections for some of the socio-economic conditions used in the SSPs. From left to right is shown population growth, Gross Domestic Product (GDP), and urbanization. Note that the SSPs shown are baselines, meaning that there is no RCP or radiative forcing associated with each SSP. Therefore, each SSP describes a future in the absence of new climate policies beyond those in place today or any new mitigation or adaptation strategies. The baseline SSP projections are shown in comparison to ranges produced from peer-reviewed scientific literature.Reference6Reference7
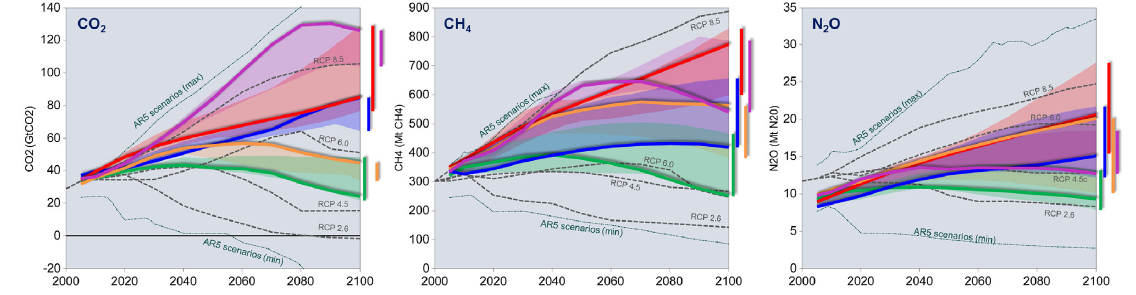
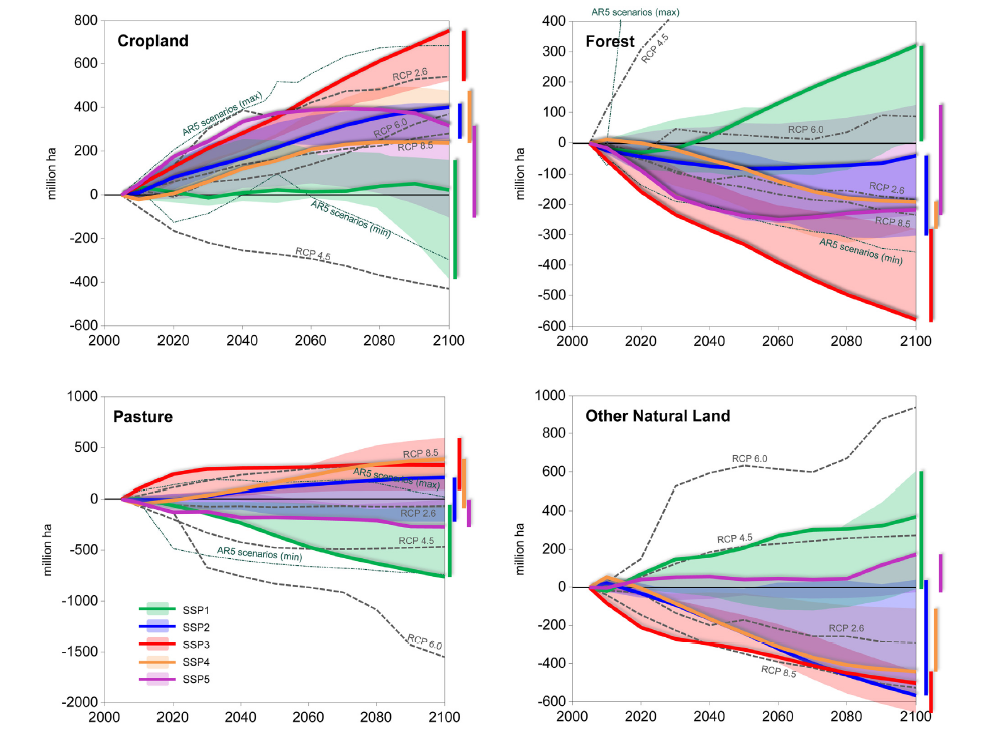
Figure 4. Differences in the projections of global greenhouse gas emissions for carbon dioxide (CO2), methane (CH4), and nitrous oxide (N2O) across SSPs are shown in the top three plots. The bottom four plots demonstrate projected changes in some land-use conditions across SSPs. Projected changes are relative to 2010 with thick lines showing the baseline SSP projections, and coloured areas showing the range of projections for all possible radiative forcing combinations. CMIP5 RCPs are added for comparison purposes. Note that ‘other natural land’ includes all land-categories beyond forests, pasture, cropland, and build-up areas.Reference5Reference6
CMIP5 versus CMIP6
The first volume of AR6 (Working Group I: Physical Science Basis) provides a detailed comparison of the CMIP5 and CMIP6 results and provides projections from both.Reference2Reference3Reference8 Overall, while there is some improvement in the CMIP6 generation of models, CMIP5 and CMIP6 results are generally comparable.
One notable difference between CMIP5 and CMIP6 models is in their climate sensitivity – this is a measure of how much global mean temperature changes in response to a particular change in CO2 concentration. There are two standard measurements of climate sensitivity: equilibrium climate sensitivity (ECS), which is the temperature change following an instantaneous doubling of atmospheric CO2, and transient climate response (TCR), which is the temperature change when atmospheric CO2 has doubled in an idealized situation where CO2 increases at 1% per year. Although there remains considerable uncertainty in these values [to be updated once IPCC AR6 assessed range is available], it is apparent that the multi-model average value for both ECS and TCR is slightly higher in the CMIP6 models than in the CMIP5 models, albeit with a wider range in CMIP6.Reference4 This implies that for a given increase in CO2, the CMIP6 models will simulate a slightly larger climate change than the CMIP5 models. It should be noted that we cannot directly observe climate sensitivity and so cannot definitively say which model results are closest to the ‘correct’ value; however, the IPCC assessment reports combine various lines of indirect evidence to produce an assessed range (shown in Figure 5 below). In the case of TCR, the latest assessed range from the AR6 is 1.4-2.2°C (would be the red bar for AR6/CMIP6 in Figure 5) and the likely range for ECS is 2.5-4.0°C (would be the blue bar for AR6/CMIP6 in Figure 5).
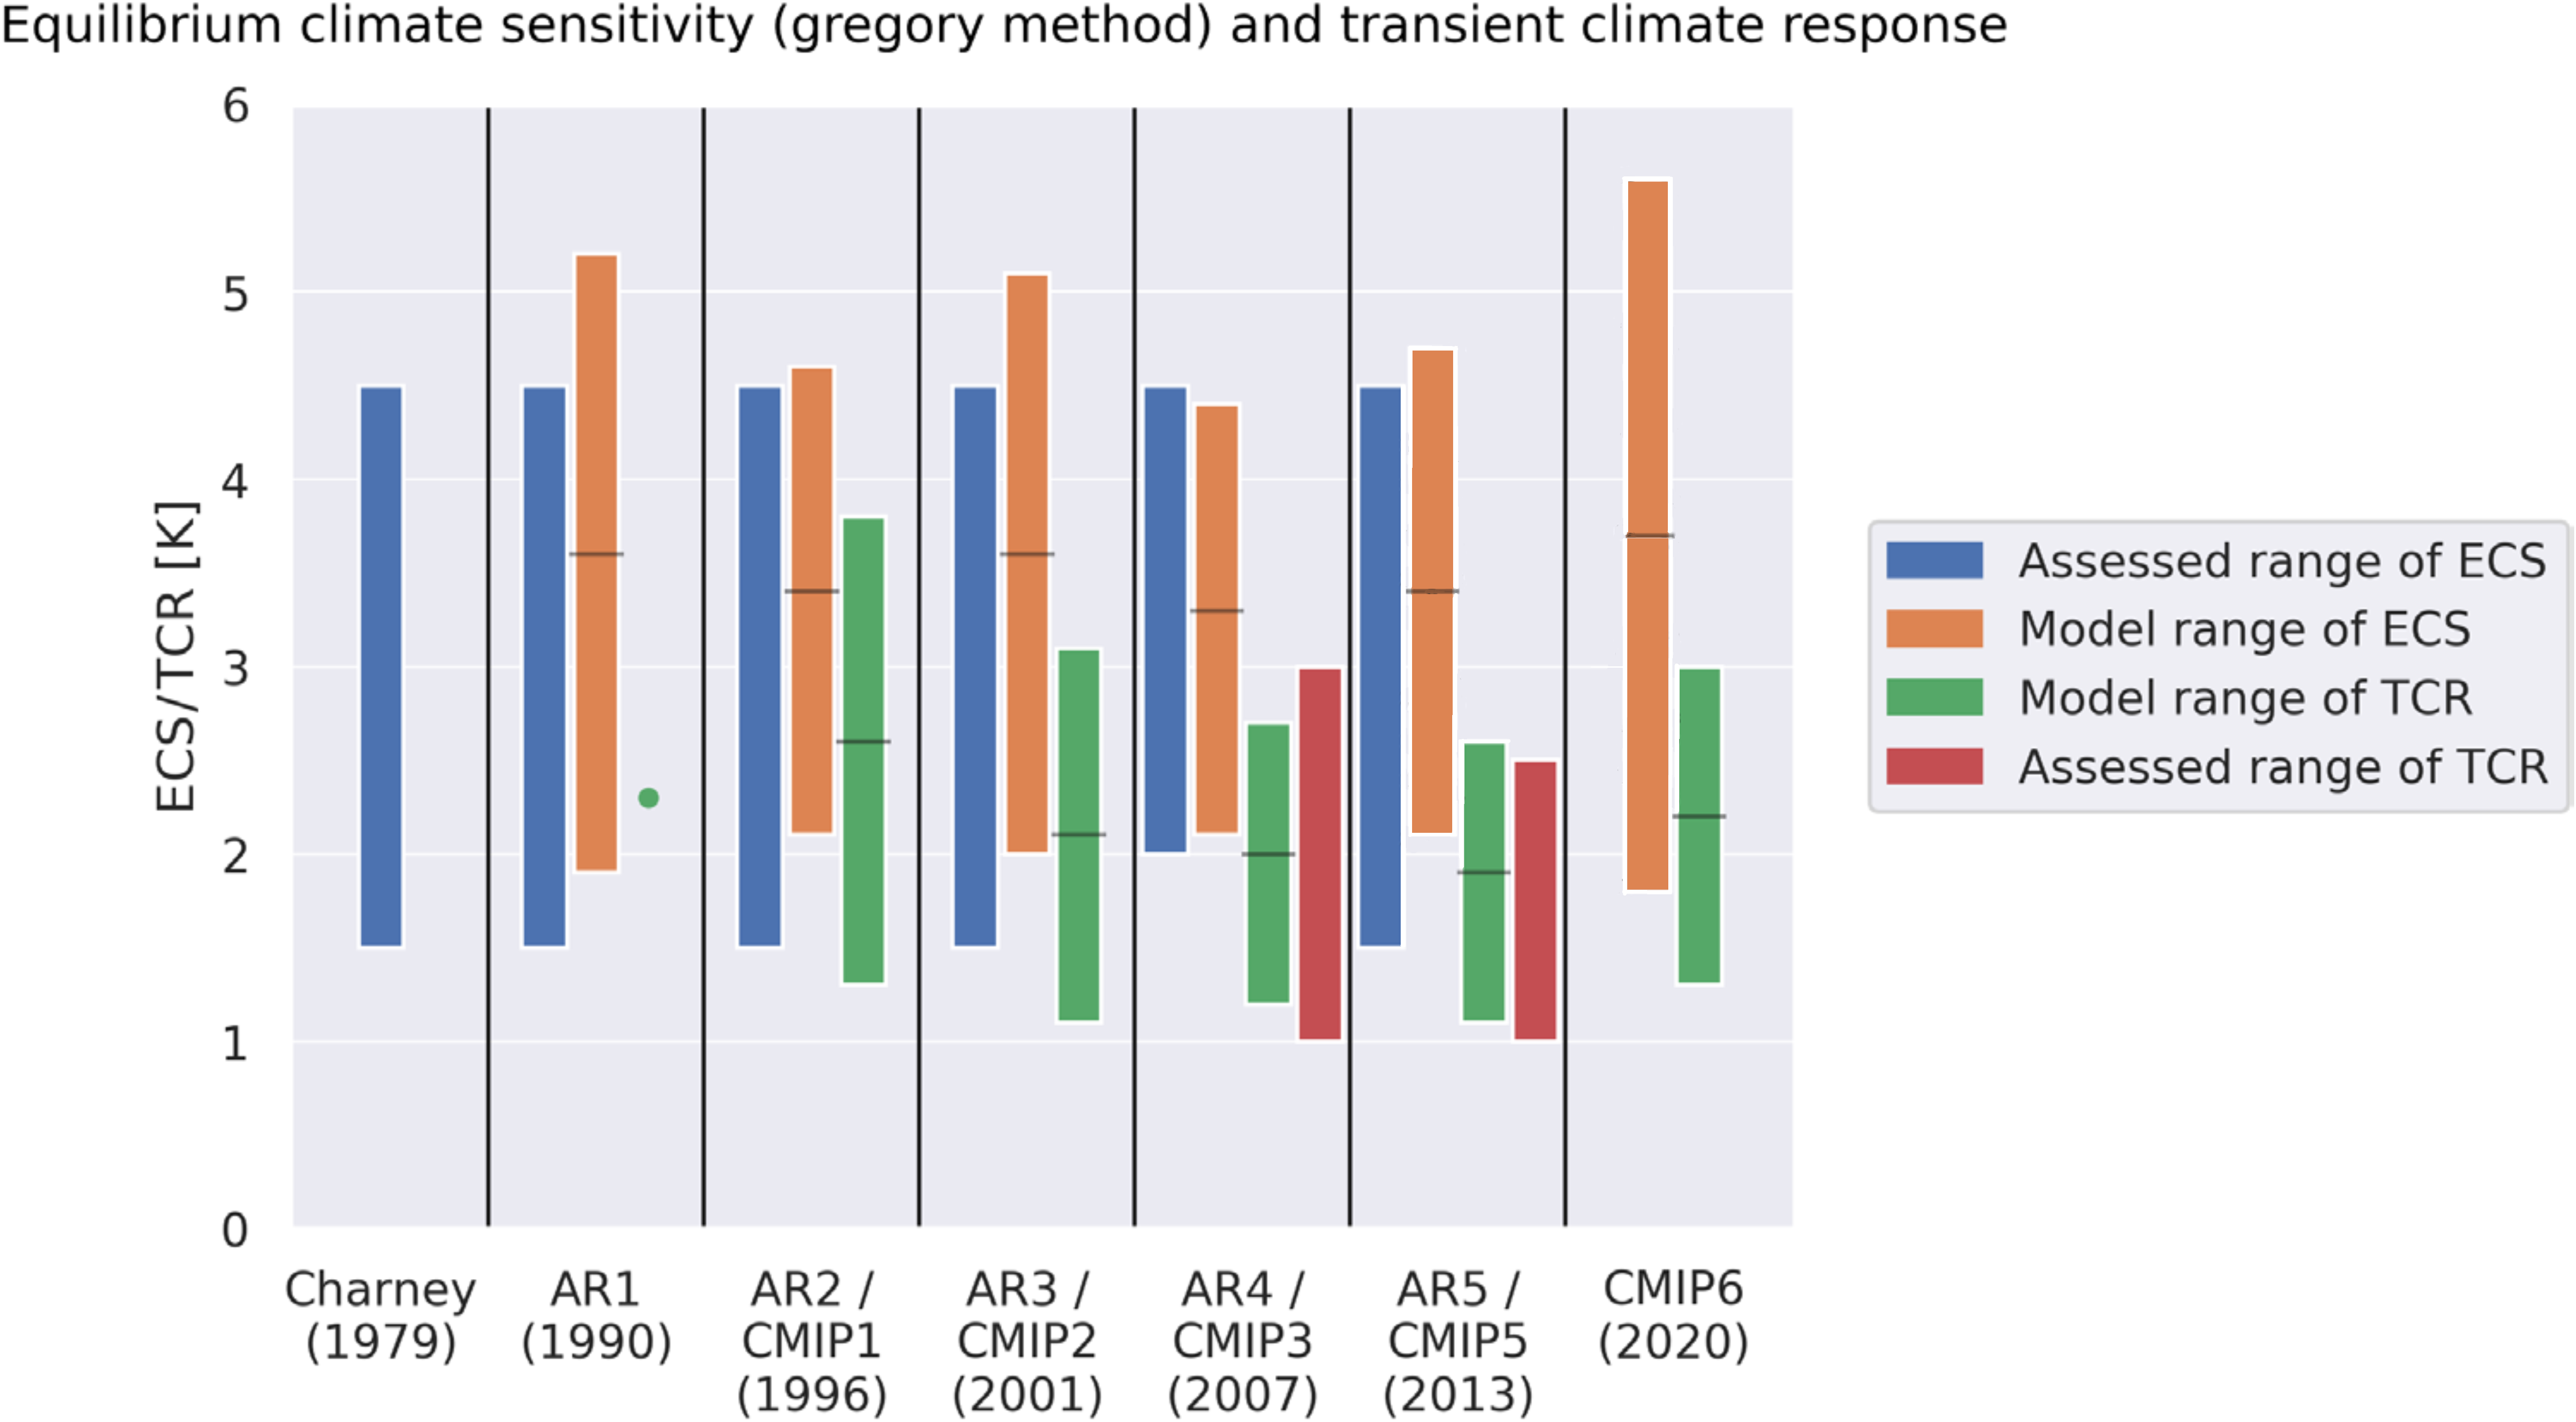
Figure 5. Equilibrium climate sensitivity (ECS) and transient climate response (TCR) from models across the history of CMIP, along with earlier estimates.Reference4 The length of the coloured bar represents the range of model projections (e.g. shorter bars demonstrate less range and more model agreement) and the horizontal black line over each bar indicates the multi-model average. AR6 is not included in this plot as the results are still preliminary, the assessed ranges are currently, 2.5-4.0°C for ECS (blue bar) and 1.4-2.2°C for TCR (red bar).