
AR4 2050s ensemble scenarios
This page has been archived on the Web
Information identified as archived is provided for reference, research or recordkeeping purposes. It is not subject to the Government of Canada Web Standards and has not been altered or updated since it was archived. Please contact us to request a format other than those available.
AR4 Ensemble Scenarios: 2050s Change Relative to 1961-1990
The CCDS has produced a summary of findings from the IPCC AR4 (2007) modelling assessment for Canada. Twenty-four international modelling centres have contributed to the international dataset. The output used in this analysis is a mean ensemble from all available international modelling centres. Not all centres have produced runs for all emission scenarios. The models are outlined below:
Climate Centres
| Centre | Model |
|---|---|
| Bjerknes Centre for Climate, Norway | BCM2.0 |
| Canadian Centre for Climate Modelling and Analysis (CCCma), Canada | CGCM3T47 |
| Canadian Centre for Climate Modelling and Analysis (CCCma), Canada | CGCM3T63 |
| Centre National de Recherches Meteorologiques, France | CNRMCM3 |
| Australia's Commonwealth Scientific and Industrial Research Organisation (CSIRO), Australia | CSIROMk3.0 |
| Australia's Commonwealth Scientific and Industrial Research Organisation (CSIRO), Australia | CSIROMk3.5 |
| Max Planck Institute für Meteorologie, Germany | ECHAM5OM |
| Meteorological Institute, University of Bonn Meteorological Research Institute, Germany | ECHO-G |
| Institute of Atmospheric Physics, Chinese Academy of Sciences, China | FGOALS-g1.0 |
| Geophysical Fluid Dynamics Laboratory (GFDL), USA | GFDLCM2.0 |
| Geophysical Fluid Dynamics Laboratory (GFDL), USA | GFDLCM2.1 |
| Goddard Institute for Space Studies (GISS), USA | GISSAOM |
| Goddard Institute for Space Studies (GISS), USA | GISSE-H |
| Goddard Institute for Space Studies (GISS), USA | GISSE-R |
| UK Meteorological Office, United Kingdom | HADCM3 |
| UK Meteorological Office, United Kingdom | HADGEM1 |
| National Institute of Geophysics and Volcanology, Italy | INGV-SXG |
| Institute for Numerical Mathematics, Russia | INMCM3.0 |
| Institute Pierre Simon Laplace, France | IPSLCM4 |
| National Institute for Environmental Studies, Japan | MIROC3.2 hires |
| National Institute for Environmental Studies, Japan | MIROC3.2 medres |
| Meteorological Research Institute, Japan Meteorological Agency, Japan | MRI-CGCM2.3.2 |
| National Center for Atmospheric Research (NCAR), USA | NCARPCM |
| National Center for Atmospheric Research (NCAR), USA | NCARCCSM3 |
In addition, mean model results from two versions of the Canadian Regional Climate Model (CRCM), produced by OURANOS (a partner of Environment Canada) are presented. Only the two most recent versions of the CRCM are included due to a problem with lake temperature modelling in an earlier version.
RCM climate centres
| Centre | Model |
|---|---|
| OURANOS Consortium, Montreal, Canada Members: Quebec Government Departments, Hydro Quebec, Environment Canada, Universite du Quebec a Montreal, Universite Laval, McGill University, Institute national de la recherch é scientifique (INRS), Ecole de technologie superieure, Manitoba Hydro, Universite du Quebec a Rimouski, Ontario Power Generation | CRCM4.2.0 |
| CRCM4.2.3 |
Introduction to Ensemble Scenarios
The use of an ensemble approach (multi-model means/medians) has been demonstrated in recent scientific literature to likely provide the best projected climate change signal. Results between models can vary widely, and models each contain their own inherent biases. The use of a mean or median of many models reduces the uncertainty associated with any individual model. In effect, the individual model biases seem to 'cancel' out one another when considered as an ensemble. Compared against historical observed gridded data, ensemble results come closest to replicating historical climate. Although not a guarantee, an ensemble collection which can best represent historical climate, is more likely to represent future climate conditions.
Figure 1:

Previously, due primarily to the difficulty in obtaining data, storing large data volumes and programming requirements, the ensemble approach has been overwhelming. Alternate methods included the use of a restricted set of model projections (two or three models), or the selection of scenarios from this small set which attempted to 'bound' projected climate variables (e.g., 'warm and dry, warm and wet, warmer and dry, warmer and wet'). Although a good approach, this technique still remains limited to a small sub-set of available models.
The current page provides an ensemble projection for all available GCM models outlined previously which have provided their data to the International Panel on Climate Change (IPCC) data warehouse or Program for Climate Model Diagnosis and Intercomparison (PCMDI). Even with these valuable resources, the retrieval of this data in its native format and subsequent conversion, formatting, interpretation, analysis and mapping is a large task not possible for many end-users and stakeholders (local government to the public). The CCDS has provided individual model results for some years now via the climate-scenarios.canada.ca website. This page provides stakeholders with the preliminary results of ensemble change fields for these models for the future commonly cited '2050s' period mean from a common baseline period mean.
The mean monthly temperature and precipitation values are calculated for each model for the periods of 1961-1990 and 2050s (2041-2070). The mean grid-cell value is then used for further analysis.
Monthly GCM model output is interpolated to a common grid (National Centers for Environmental Prediction (NCEP) resolution) at 2.5 x 2.5 degrees across Canada. The GCM model ensemble produced does not include the Canadian Regional Climate Model (CRCM). The NCEP grid resolution is shown in Figure 1.
The values presented in the maps are the projected 2050s values, minus the observed 1961-1990 values.
Levels of Projected Climate Change for 2050s Ensemble Scenarios
The results represent three levels of projected climate change for the 2050s period (2041-2070) in relation to the baseline period of 1961-1990: 'low', 'medium' and 'high'. The maps indicate the change in temperature in degrees Celsius, and for precipitation, the maps show the change in precipitation in percent from the baseline period.
The 'low' projection represents the all-model mean resulting from the least aggressive emission assumption. This is the result from the commonly referenced SRES-B1 scenario. Correspondingly, the 'high' projection results indicate projected changes with the most aggressive emission assumption. Over Canada, the mean annual temperature anomaly for the 2050s is very similar for the SRES-A2 and SRES-A1B scenarios when considering the all-model composite. In fact, the mean annual temperature increase nationally (over all grid cells for Canada), for SRES-A1B is slightly higher by 0.3°C. Since the main purpose of a 'high' projection was to indicate an upper boundary, and additionally all modelling centres generated A1B output versus A2, the A1B results were used for the 'high' projection. The 'medium' projection then represents the mean of the combination of low (B1) and high (A1B) projections. Importantly, there is no implied recommendation that one of the three emission assumptions is favoured over any other, nor would the results vary significantly if the A2 scenario was substituted for the A1B. By the 2080s projection time period (2071-2100), the A1B scenario mean temperature is surpassed by the A2 mean temperature.
Figure 2:
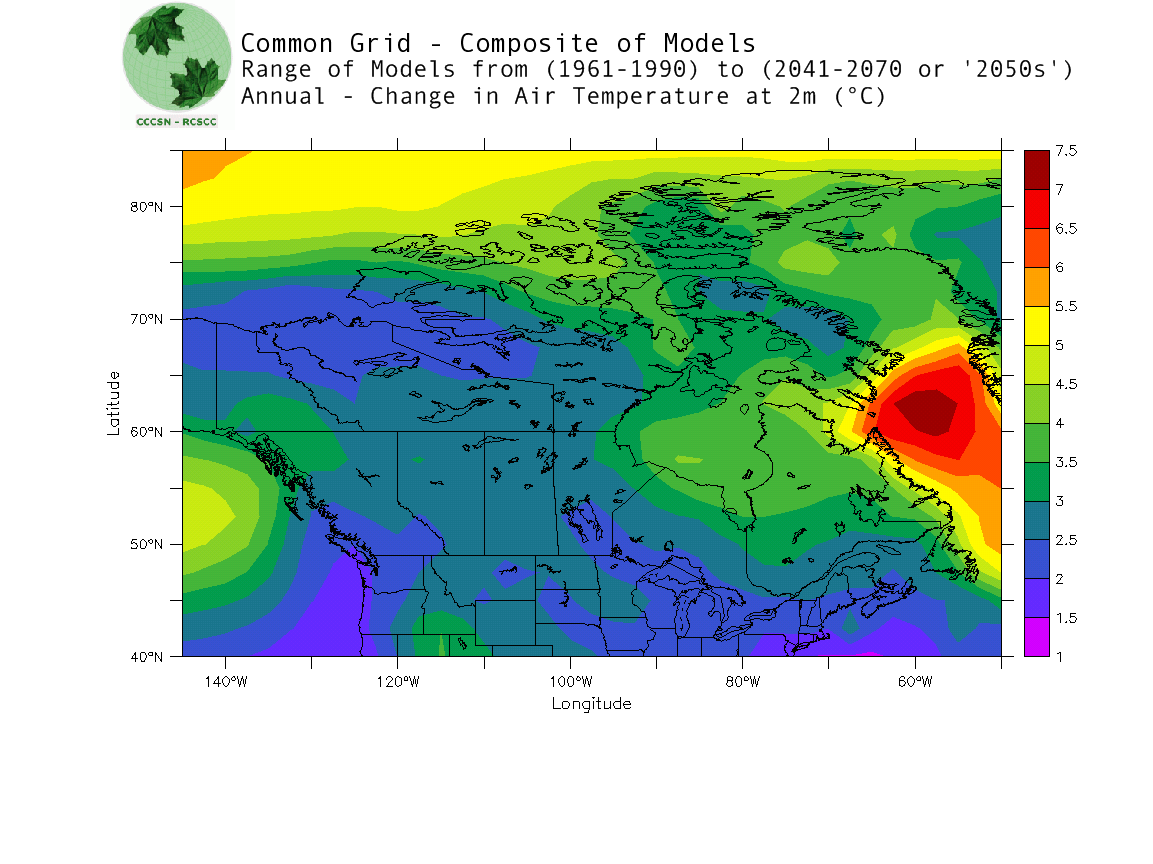
In addition to a more rigorous estimate, the use of an ensemble versus a single or small combination of models can also provide valuable information of the spatial uncertainty of projections across Canada through the range of model results. Grid cells with greater model ranges indicate regions where different model formulations (sub-grid scale parameterization, atmospheric or oceanic circulations) differ, leading to an overall ensemble projection which has greater uncertainty.
A national map indicating the range of results from all models for the 'low' emission scenario for the future 2050s (2041-2070) annual temperature projection period is shown in Figure 2. Temperature is believed to be one of the best modelled variable outputs from GCMs, yet the range in model results can be significant. In general, the models show a greater range of results over Canada's eastern Arctic (>3°C) and especially over the Labrador sea (>5°C). In southern Canada the range of model anomaly results is less than 3°C on an annual basis. Although the ranges seem very large, it is important to consider that they represent the difference between the maximum and minimum mean annual anomaly (change) from all available GCMs.
A less sensitive statistic to model outliers, the standard deviation, for the same combination just stated indicates a similar pattern (See Figure 3). The standard deviation of projected 2050s anomalies from the models over southern Canada is less than 0.7°C, increasing over the eastern Arctic to 1.2°C, and over the Labrador Sea to greater than 1.6°C where the highest value (and hence uncertainty), is found.
Figure 3:
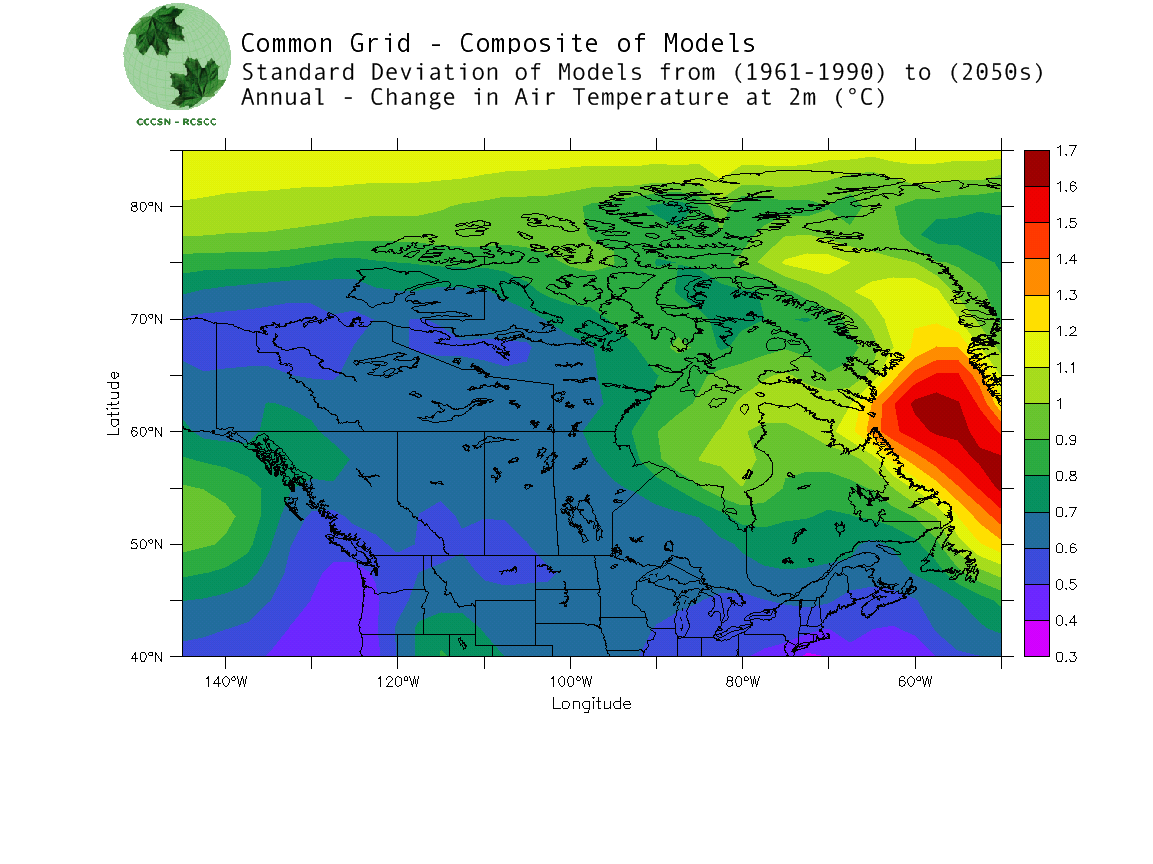
There are several possible reasons for the ranges found: different land/sea proportions in the complex Canadian Archipelago, varying sea-ice coverage including that over Hudson Bay, varying snow coverage, varying permafrost parameterization, and varying north-Atlantic ocean current strengths. Each of these components can have an impact on atmospheric circulation patterns and climate.
The CRCM 'high' ensemble is also presented in the output table. The monthly CRCM output is not regridded to the larger NCEP scale. The original 50 km resolution is used, however, the original polar stereographic projection is converted to a regular latitude/longitude grid. The baseline period for the CRCM is 1961-1990, and the scenario projection is the difference between this baseline and the 2050s (2041-2070) period, as it is for the GCM results. The CRCM model is only available for the SRES-A2 'high' scenario.
Select an Ensemble Scenario
2050s Change relative to 1961-1990
Notes on usage:
- Data used in this analysis is provided by IPCC / PCMDI / Environment Canada / OURANOS courtesy of individual international modelling centres. Comments are welcome at ec.ccds.info-info.ccds.ec@canada.ca
- Data analysis and mapping presented on this page was developed by the Canadian Climate Change Scenarios Network team of the Adaptation and Impacts Research Section (AIRS) of Environment Canada.
- More information on scenarios is available on climate-scenarios.canada.ca
The information provided on this page is provided 'as is' with no warranty or conditions. Credit for use of this information should be given as:
'CCCSN (2009). Ensemble Scenarios for Canada, 2009. Produced by the
Canadian Climate Change Scenarios Network (www.CCDS.ec.gc.ca). Editor: N. Comer.
Adaptation and Impacts Research Section, Environment Canada.'