HadCM3 predictors: A2(a) and B2(a) experiments
This page has been archived on the Web
Information identified as archived is provided for reference, research or recordkeeping purposes. It is not subject to the Government of Canada Web Standards and has not been altered or updated since it was archived. Please contact us to request a format other than those available.
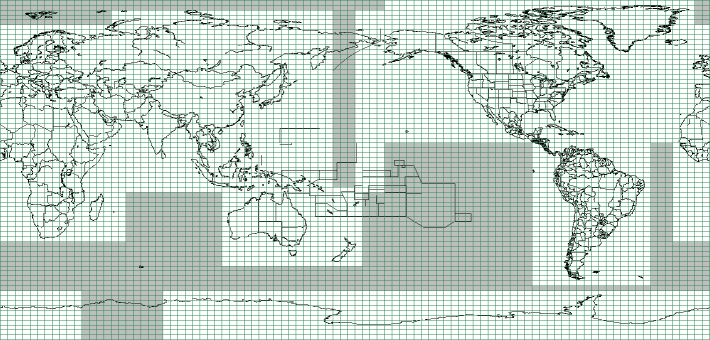
In order to reduce data volume, the global window has been divided into seven smaller windows, with each window encompassing a major land area, with the land-sea boundaries defined according to the HadCM3 land-sea mask. To download HadCM3 predictors you must select a region on the map below.
The predictor variables are supplied on a grid box by grid box basis. On entering the location of your site, the correct grid box will be calculated and a zip file will be made available for download. When unzipping this file, make sure that you maintain the directory structure - this usually means that you must check the appropriate option in whichever zip software you are using. Each zip file contains three directories:
- NCEP_1961-2001: This directory contains 41 years of daily observed predictor data, derived from the NCEP reanalyses, normalised over the complete 1961-1990 period. These data were interpolated to the same grid as HadCM3 (2.5 latitude x 3.75 longitude) before the normalisation was implemented.
- H3A2a_1961-2099: This directory contains 139 years of daily GCM predictor data, derived from the HadCM3 A2(a) experiment, normalised over the 1961-1990 period.
- H3B2a_1961-2099: This directory contains 139 years of daily GCM predictor data, derived from the HadCM3 B2(a) experiment, normalised over the 1961-1990 period.
For more information on predictors, see Predictors Help.
Click here to obtain the grid definition. The latitude and longitude coordinates correspond approximately to the centres of the grid boxes.