
User guide for seasonal forecasts
A seasonal forecast gives a snapshot of a specific 3-month period in the future. It is similar to a weather forecast as it considers historical weather observations but differs from a weather forecast because it accounts for the larger global climate system, including factors such as ocean and atmospheric circulations.
Weather forecasts are often referred to as deterministic—for example, predicting the exact temperature an hour or day in advance. Forecasters can make deterministic predictions for a shorter forecast, but since weather is chaotic and constantly changing, creating a forecast that is several months to a year into the future utilizes what is known as probabilistic forecasting.
On this page
- What is a probabilistic forecast?
- How to interpret the seasonal probabilistic forecast
- 1. What do the probabilistic seasonal forecast maps represent?
- 2. What do the skill maps represent?
- 3. What do the reliability diagrams represent?
- 4. What is the climatology of the region?
- Variables available
- Examples of how seasonal probabilistic forecasts can be used
- References
What is a probabilistic forecast?
One way to think about probabilistic forecasts is by considering this example: you are trying to predict how long it will take to drive from one city to another three months from now. With unknown possible construction and traffic delays, it is hard to know precisely how long it will take. You drive this route monthly and have a range of previous travel times. Based on your previous experiences, you have 20 attempts to predict the amount of time your next trip will take. Of those 20 predictions, you will have some that exceed your historical times, some where your travel time is close to your historical average, and others that will predict a shorter time.
Similarly, Environment and Climate Change Canada’s seasonal forecast produces the probability of a certain variable, for example, the average temperature, being above, near, or below normal. Climate models that consider the historical averages are run 20 times, with each simulation predicting a different seasonal forecast and producing a range of possible outcomes.
The next step is to determine which of the predicted outcomes - above, near, or below normal - is the most likely, and how much confidence and trust should be placed in the forecast.
Elements of the probabilistic forecast
Looking at the 20 attempts, how many times was each outcome predicted? Suppose most travel times are predicted to be above average because a lot of construction is planned for three months from now, then there is a much higher probability of an above average travel time compared to an average or below normal travel time. Using probabilities is one way a forecast’s uncertainty can be quantified, knowing that while one outcome might be the most likely, the other outcomes are not entirely unlikely.
There are two other ways to consider the uncertainty of the forecast – one of which is the skill of the forecast. How accurate have your predictions been in the past? If the most probable outcome has usually turned out to be wrong once you take the trip, then the skill of your predictions is considered low, and the model, method, or past data is insufficient for you to trust your current forecast.
The final way to consider uncertainty is by evaluating the reliability of the forecast. How do the observed frequencies of above, near, and below normal conditions compare with the frequencies of each outcome in your prediction? If your drive historically takes longer than average 33% of the time, but 65% of your predictions say it will take longer than normal to drive, then your forecast may not be reliable.
The Canadian Climate Data and Scenarios (CCDS) site provides Canadian and global probabilistic seasonal forecast maps with accompanying skill maps and reliability diagrams. This guidance document details how to interpret the forecast, skill, and reliability to make an informed decision about these predictions.
How to interpret the seasonal probabilistic forecast
Users should evaluate the forecast by considering four main components: the forecast probabilities, skill maps, reliability diagrams, and climatology of the region.
1. What do the probabilistic seasonal forecast maps represent?
The seasonal forecast maps are coloured to display the probability of occurrence of the most likely of the three tercile categories for the seasonal mean: above normal, near normal, or below normal. In addition, numerical probabilities (%) for all three categories appear in the location of the mouse cursor or from a tap. These probabilities are obtained from an ensemble of 20 different forecasts (two different forecast models run 10 times each). The categories are defined in terms of past seasonal means during a 30-year climatological period (currently 1991-2020). A seasonal mean is:
- Above normal if it exceeds its climatological average (the average for that season over all years in the climatological period) by more than 0.43 times its interannual standard deviation (the standard deviation of the 30 seasonal means during those years).
- Below normal if it falls more than 0.43 standard deviations below the climatological average.
- Near normal if it lies within 0.43 standard deviations of the climatological average.
The 0.43 standard deviation threshold makes each category equally probable (same 33% probability) on average. Forecast probabilities greater than 33% mean that the odds are tilted toward that category, and forecast probabilities less than 33% mean that the odds are tilted away from that category. Maps of the observed climatological average and 0.43 standard deviation threshold for a 1981 to 2010 climatological period (to be updated to 1991 to 2020) for temperature and precipitation in all the regions of Canada are found here. A more detailed explanation of how these forecasts are produced is found here.
The breakdown of probabilities indicates the confidence of the forecast. For example, a forecast where the above normal category has the highest probability at 45% relative to 30% for normal and 25% for below normal, an above normal outcome is the most likely. However, compared to a forecast with probabilities of 60% (above), 25% (normal), and 15%, we would be less confident in the first forecast. In the latter case, the forecast shows better than even odds (greater than 50%) of above normal conditions, accompanied by relatively small odds of normal and below normal conditions.
It should be noted that the near normal category tends to be less well predicted than the above and below normal categories.Reference1Reference2Reference3 The main reason for this is that the above and below normal categories are open-ended. In other words, they are only constrained on one side by the near normal category. Thus, a seasonal mean will be above normal whether it is slightly or highly above normal, and the same applies to the below normal category. On the other hand, the near normal category is constrained on both the high and low sides, and as such, it has a comparatively smaller range of applicable values. Therefore, less confidence should be placed on the near normal forecast probabilities compared to the above or below normal forecast probabilities.
Interpreting the probabilistic seasonal forecast maps
The seasonal forecast map is interactive: by moving the cursor over the map (or tapping on a particular location), a pop-up of information appears for that point on the map showing the probabilities for the above, near and below normal categories in an area of interest. Alternatively, search for a location in the table below the map. Generally, a higher probability indicates higher confidence in the forecast (see examples below). Note: Seasonal forecasts do not predict extreme weather events. For more information on what is predicted by Environment and Climate Change Canada seasonal forecasts, please read this frequently asked questions page.
Colour bars on the bottom or right side of the forecast maps (for Canada and global, respectively) indicate the forecast probabilities in 10% intervals (see Figure 1 and Figure 2). For the temperature variable, the colours range from yellow to red for above normal, grey to purple for near normal, and light to dark blue for below normal. These colours will change based on the variable selected from the dropdown menu. The colours on the map display the category with the highest probability, with white over a region with an “equal chance” of occurrence, i.e. where no category’s probability exceeds 40%. The months for which the forecast is valid are indicated at the bottom of the map in red font and correspond to the period selected (Figure 1). The date of issuance is shown in the top right corner of the map.
Figure 1 shows the probability breakdown for a point in Yukon and the skill for that location. There is a 58% chance of below normal conditions for the period of March to May, with high skill of 66%. The following section elaborates on how skill is measured. The global seasonal forecast shown in Figure 2 also displays this level of information in the same format.
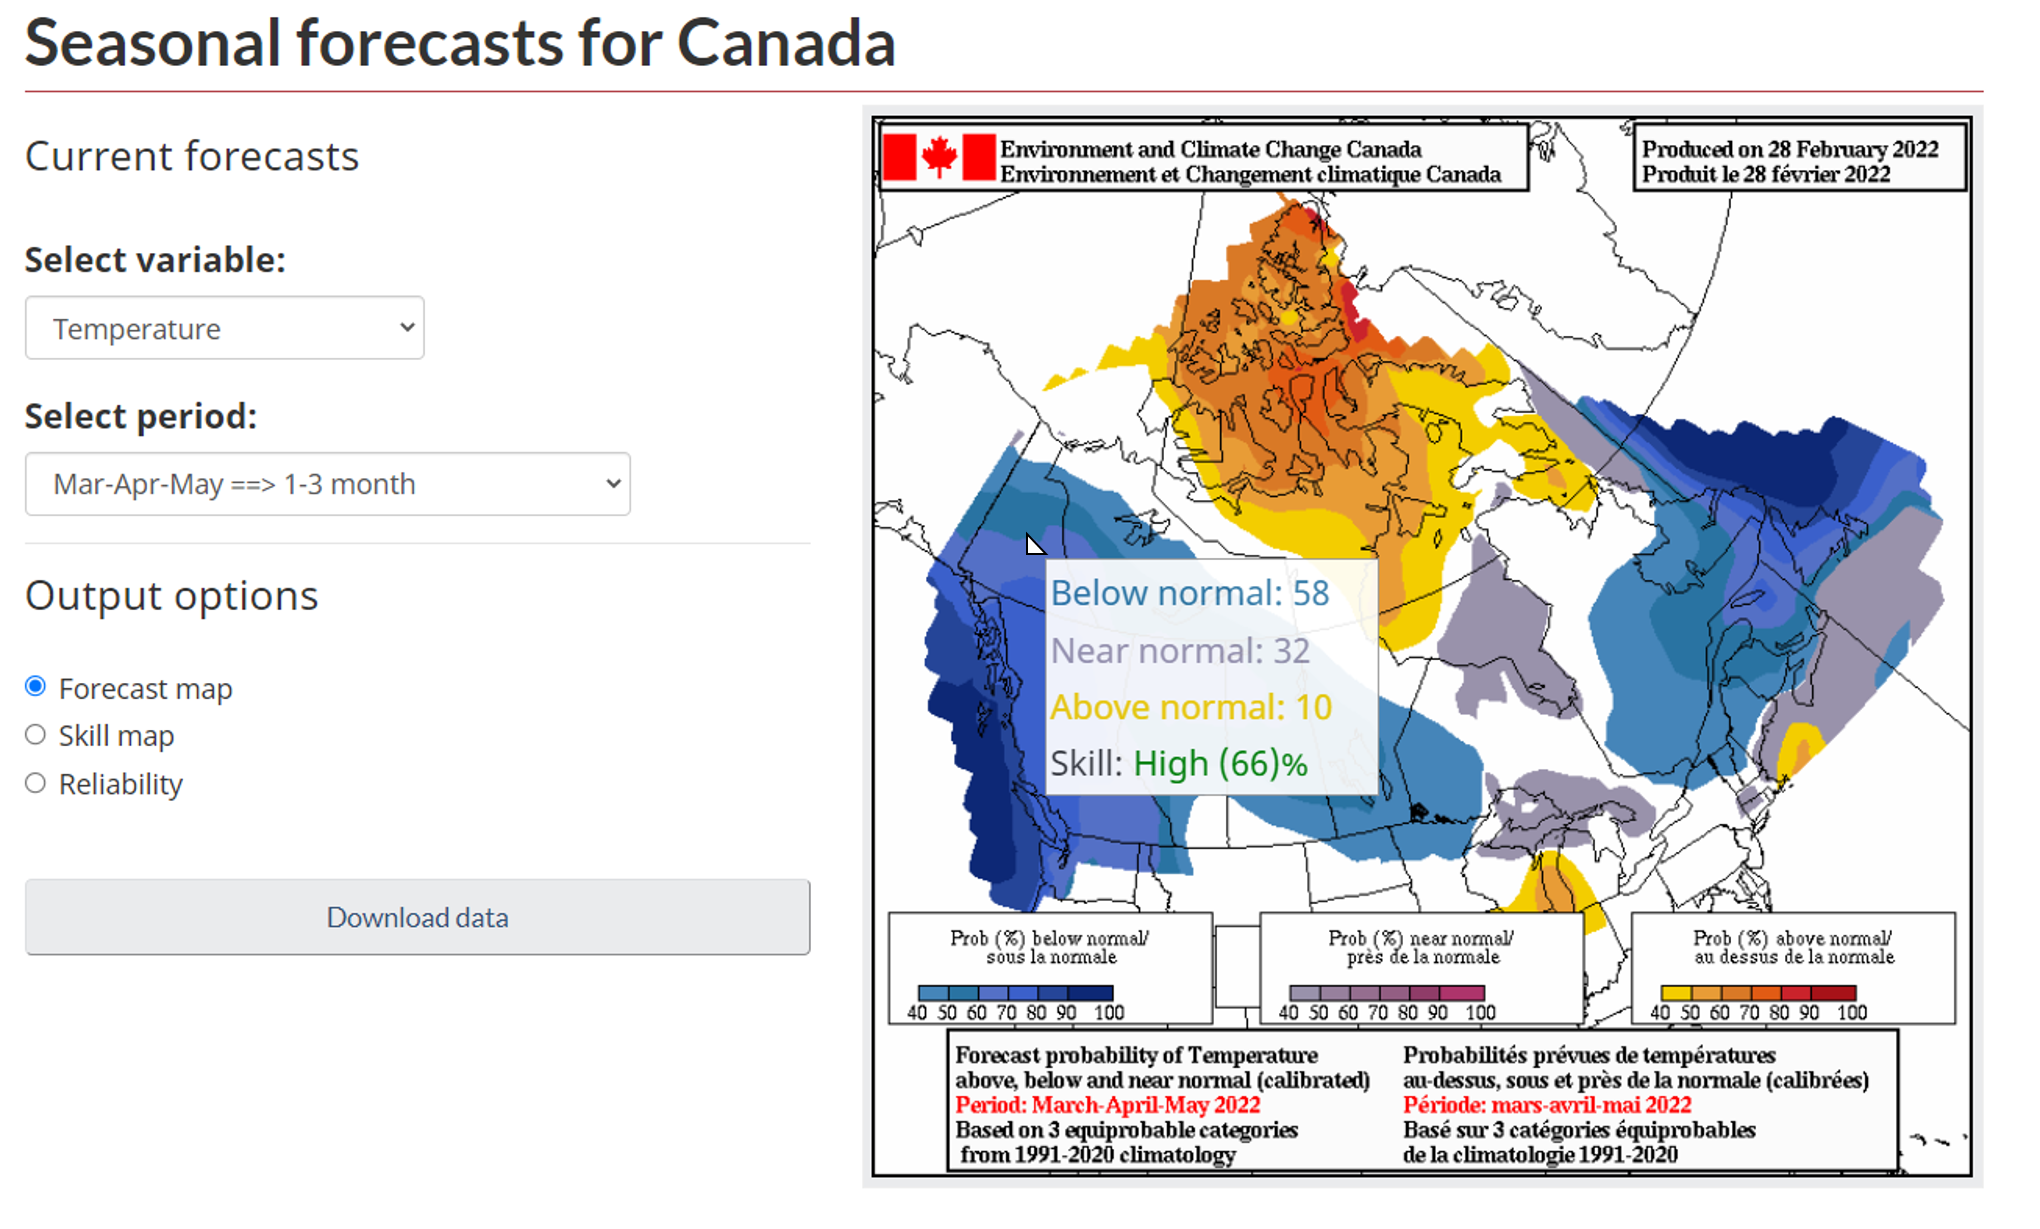
Figure 1. Seasonal forecast for Canada from the CCDS site, showing a probabilistic forecast (March 2022 to May 2022) for mean temperature. The time between when the forecast was created and when the forecast starts is 0 months, also known as lead time. The tercile probabilities and skill numbers are shown for a location in Yukon.
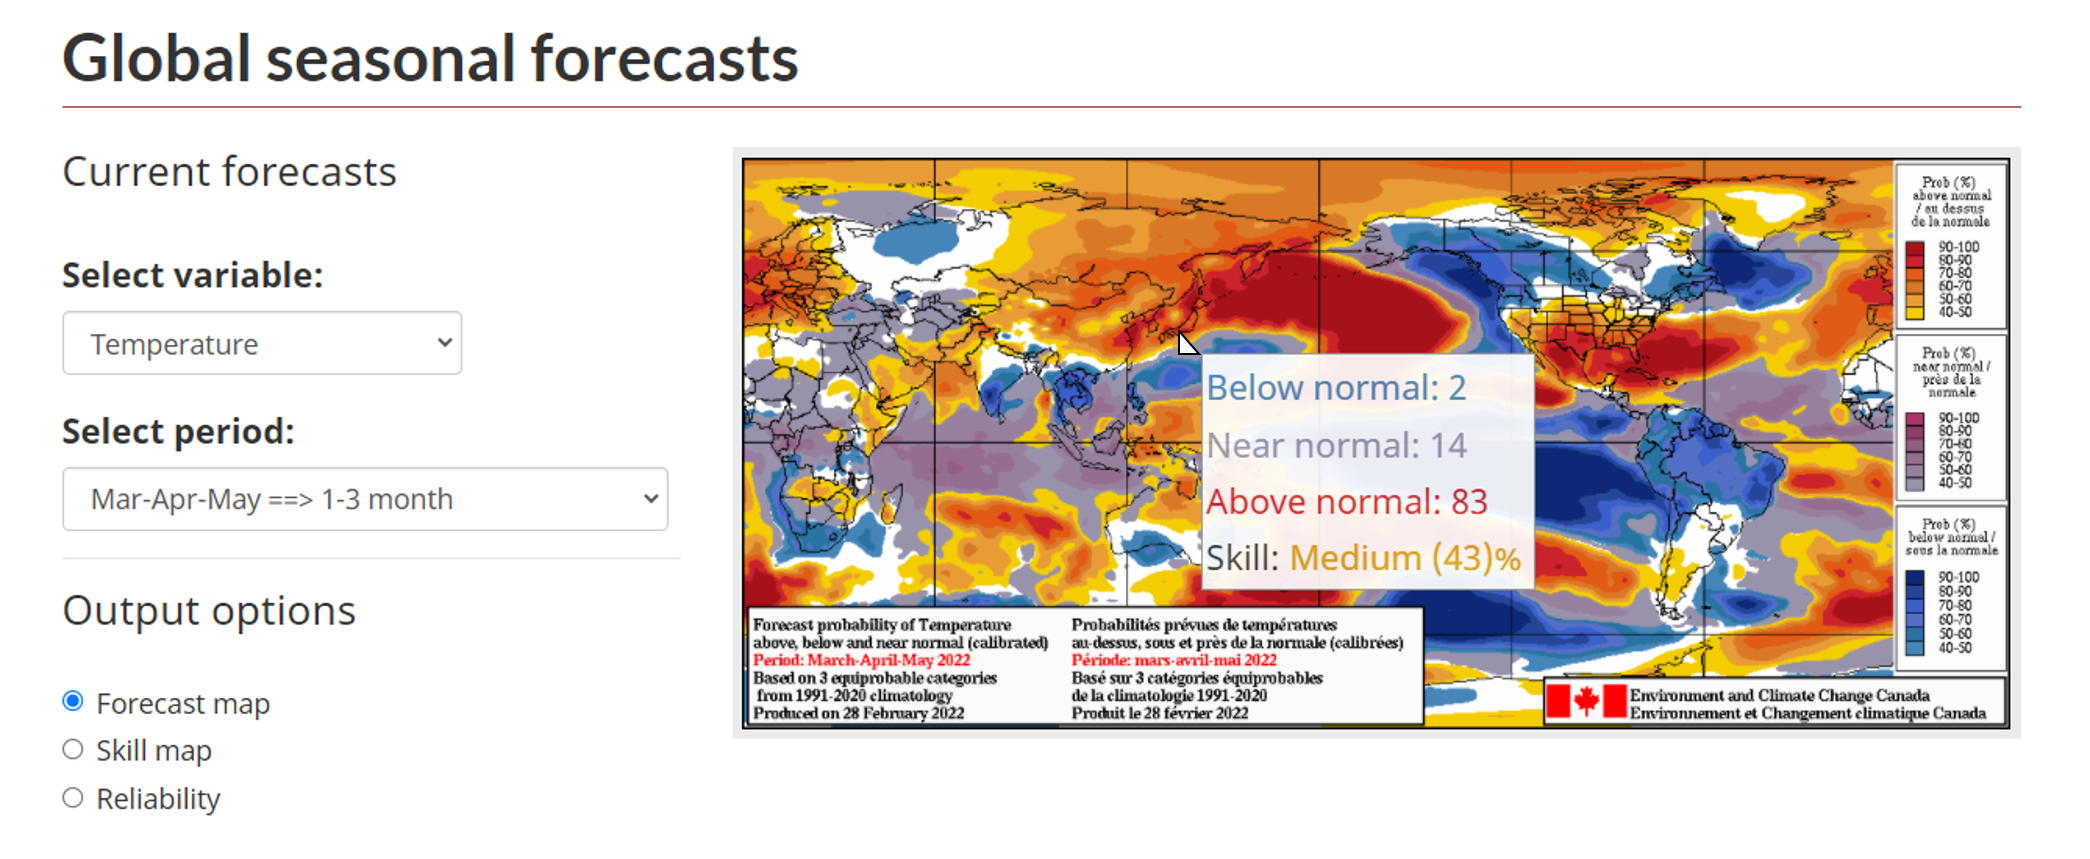
Figure 2. Global seasonal forecast from the CCDS site, showing a probabilistic forecast (March 2022 to May 2022) for mean temperature. The time between when the forecast was created and when the forecast starts is 0 months, also known as lead time. The tercile probabilities and skill numbers are shown for a location in Japan.
2. What do the skill maps represent?
The skill maps show how the prediction system has previously performed, as an indication of how much trust to place in the current forecast. The forecast is considered skillful when the percent correct is 40% or greater. For example, suppose the skill is listed as 60% for a given season and lead time (the time between when a forecast is created and when the forecast period starts). This means that the correct category (above, below, or near normal) was forecasted for that season and lead time in 60% of historical cases. If the value is lower than 40%, the forecast is not statistically better than pure chance, so trust in the forecast is very low.
The skill maps that accompany each forecast indicate the skill of the prediction system, depending on the location, through verification of the forecasts over many previous years (typically 30).Reference4
Interpreting the skill maps
Select a location of interest on the skill map or read the skill (percent correct) in the table below the map for a listed location.
The skill maps (Figure 3 and Figure 4 below) show the percent correct (PC) score, which measures how often each category has been accurately predicted, with a higher percentage indicating better forecasting ability. Skill is categorized in the following ranges:
- PC less than 40%: low skill
- PC of 40% to 59%: medium skill
- PC 60% or greater: high skill
Only regions with a percent correct value of 40% or greater are shown in colour on the map. The grey colour indicates areas with percent correct values below 40%, meaning the skill of the forecast for those areas is not significant. Skill maps vary based on the season, location, lead time (how far in advance the forecast is, with forecasts further in advance usually having lower skill), and variable of interest. When evaluating a region’s forecast, check whether the percent correct corresponds to low, medium, or high skill. If skill is low, then forecast probabilities based on climatology (33% for each category) may be preferable.
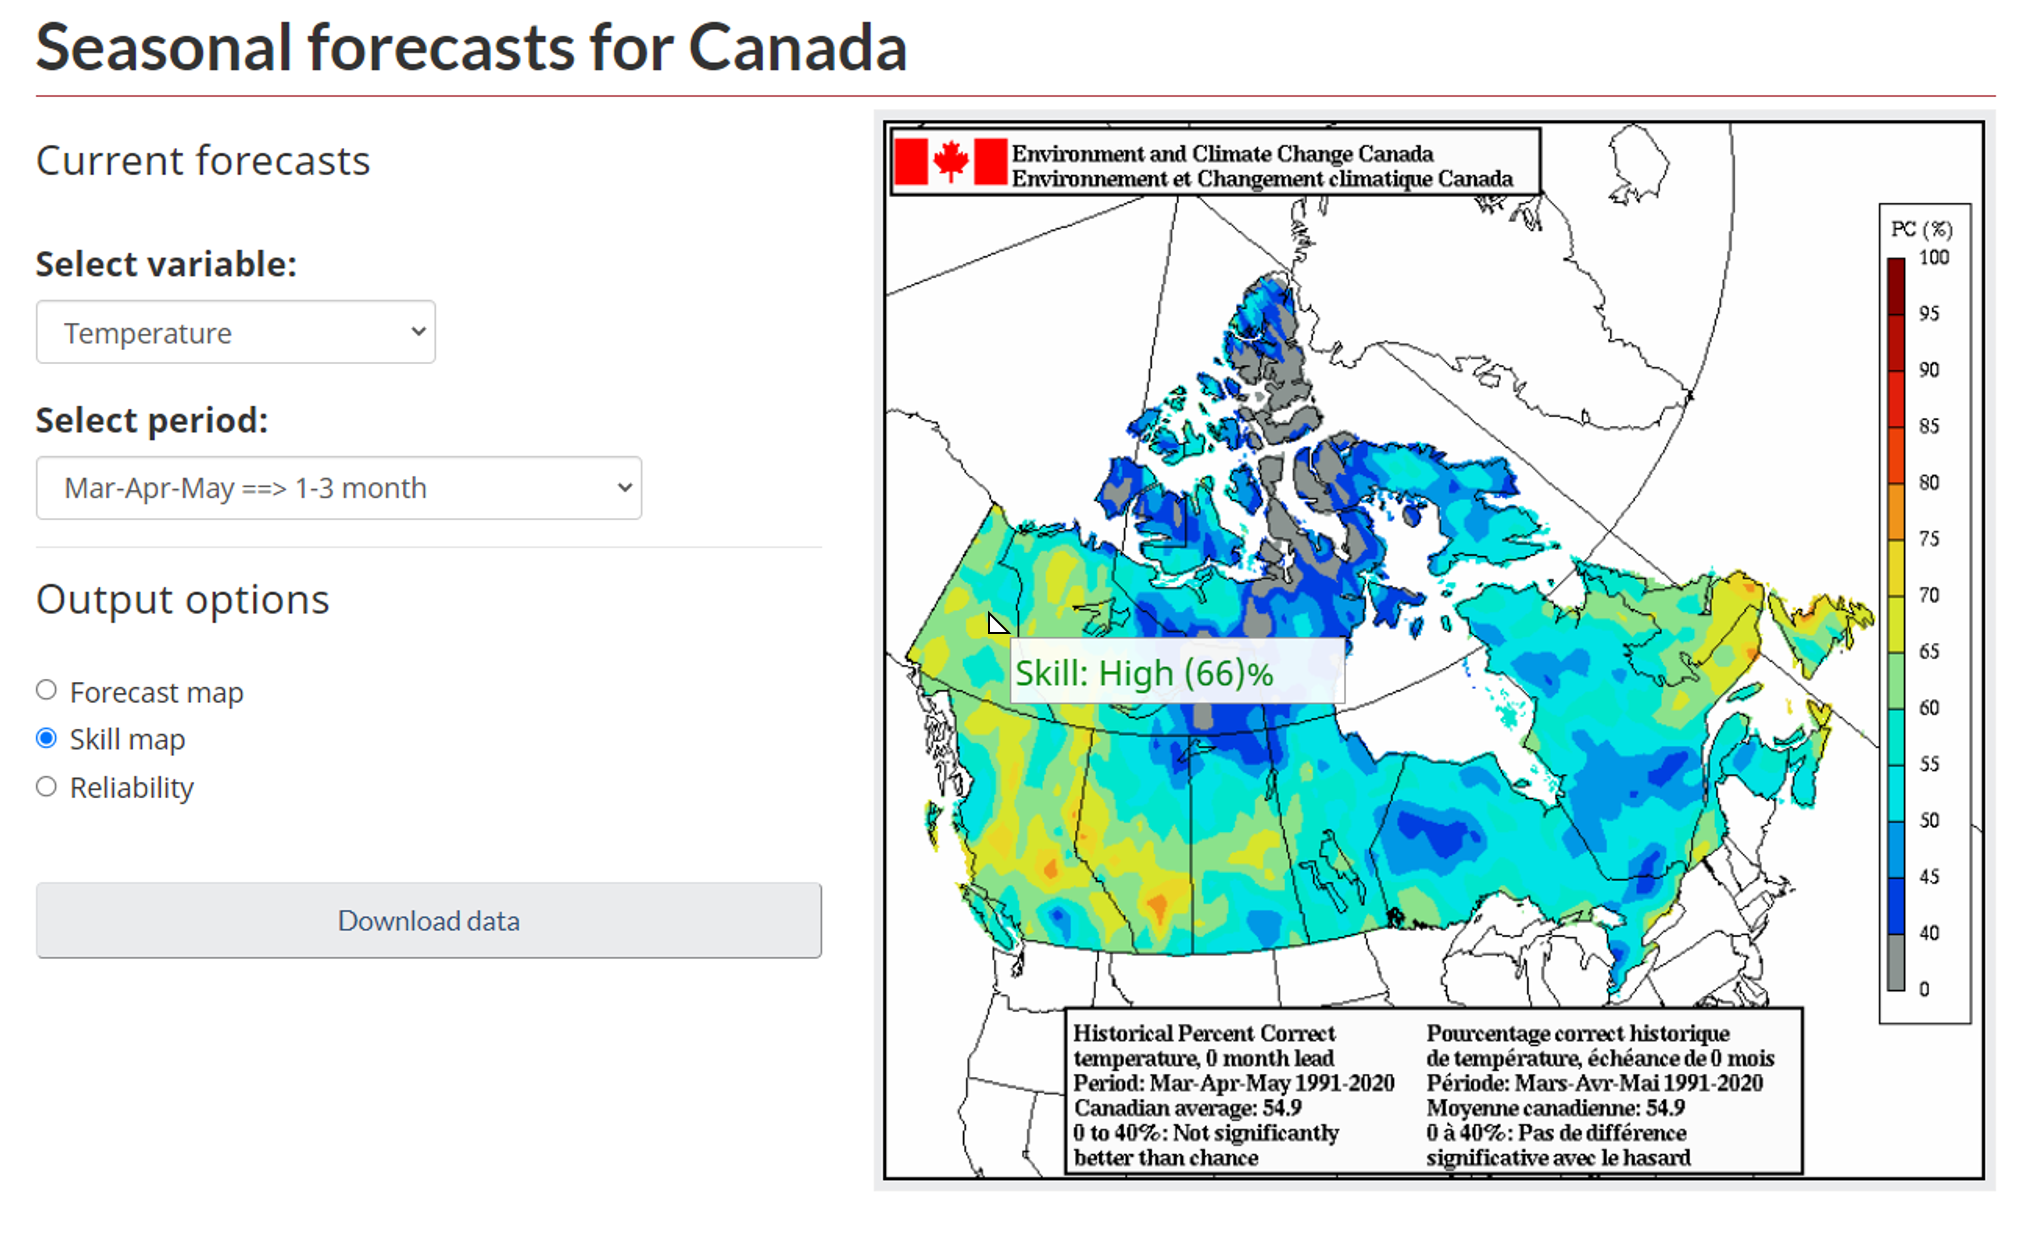
Figure 3. Temperature skill map of the CanSIPSv2 seasonal forecast for the historical period of March to May 1991 to 2020 in Canada. The colours represent the percent correct (PC) during the reference period, with a location in Yukon showing high skill of 66%.
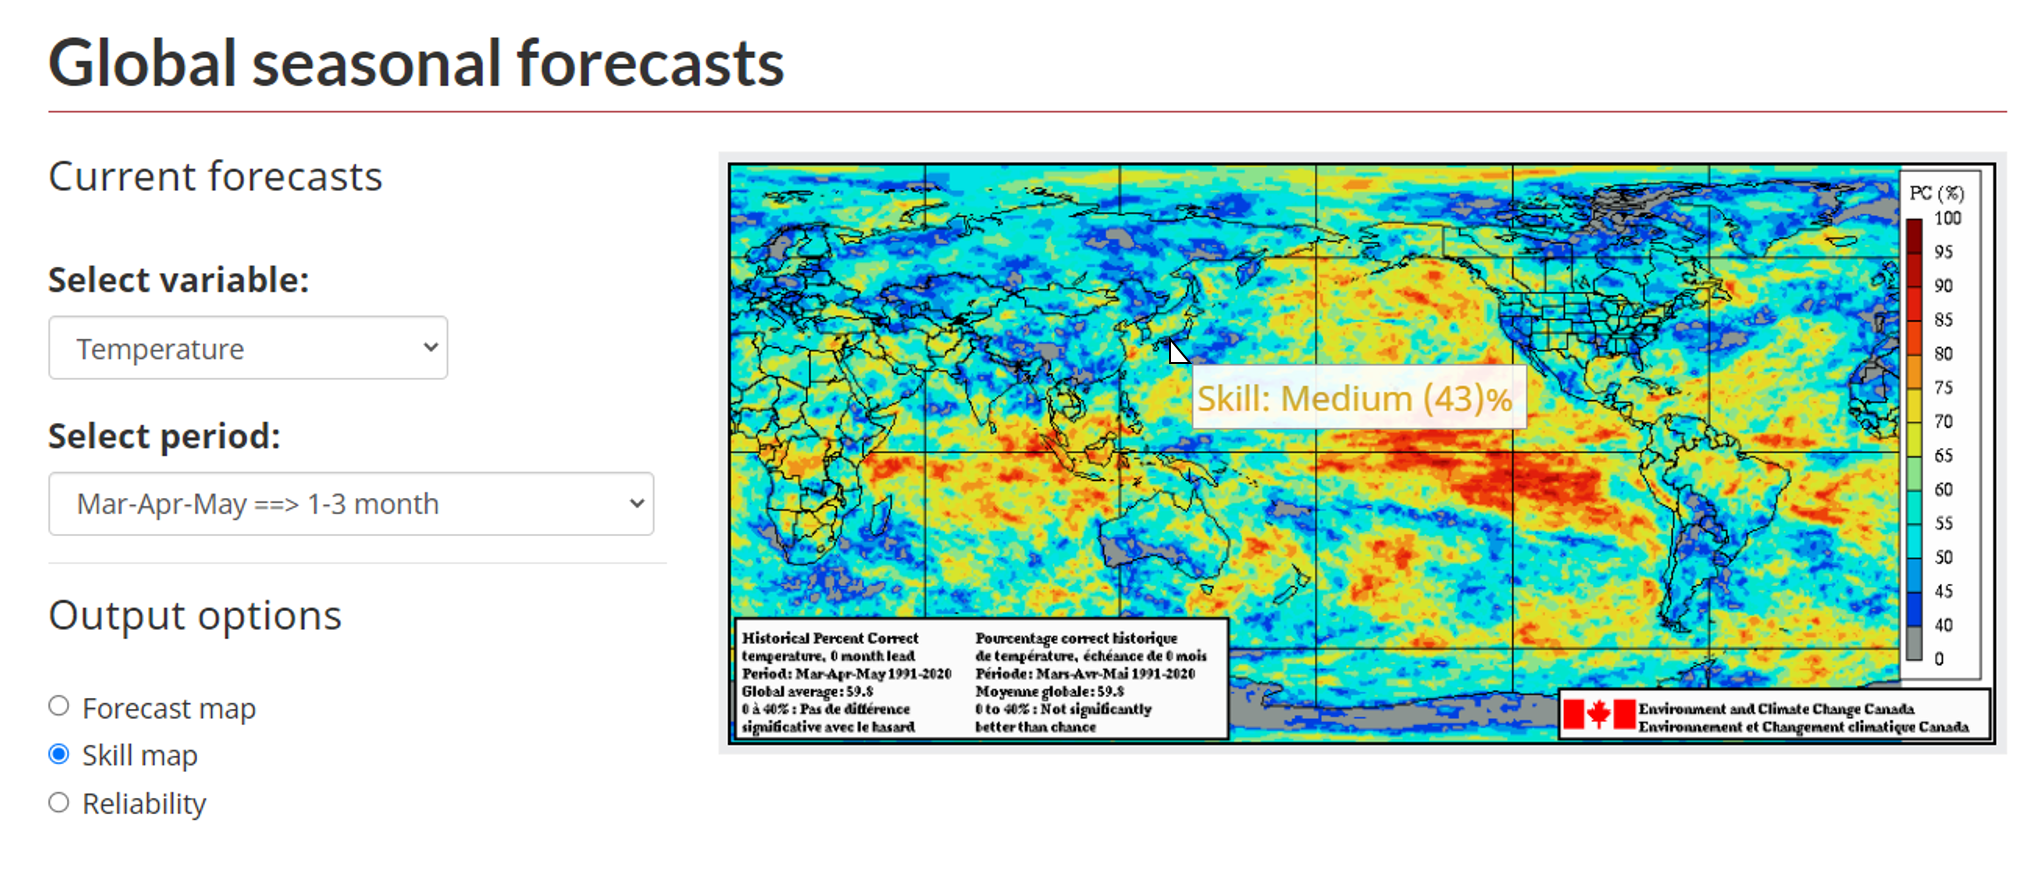
Figure 4. Temperature skill map of the CanSIPSv2 seasonal forecast for the historical period of March to May 1991 to 2020 globally. The colours represent the percent correct (PC) during the reference period, with a location in Japan showing medium skill of 43%.
3. What do the reliability diagrams represent?
The reliability diagram, also known as the attributes diagram, is the same across all locations and shows the reliability of the forecast will change based on how far in advance the forecast was created (lead time), the months being evaluated, the variable, and the category (above, near, and below normal). A “perfect forecast” is when the observed frequencies equal the forecast probabilities, in which case the coloured lines in the reliability diagram will all lie along the ‘perfect forecast’ diagonal line labelled in Figures 5 and 6. The grey shaded area of the diagram depicts where the Brier skill score (a common probabilistic skill measure) has skill; there is no skill when a line falls outside this shaded area. Finally, the histograms at the bottom indicate how often each probability range was forecast during the climatological (historical) period.
Interpreting the reliability diagrams
Select the reliability diagram for the same variable and period chosen for the probabilities forecast and skill map. This diagram represents all locations and considers the forecast reliable if the observed frequency and the forecast probability differ by less than 10% for the different categories (above, below, and near normal).
For example, suppose the forecast for a given location is 60% above normal. For the forecast to be considered reliable, the red above normal line corresponding to approximately 60% probability (0.6 on the x-axis) should be within 10% (above or below) of the line labelled 'perfect forecast' that runs the length of the diagram. The perfect forecast line is a guide for when the forecast probability and observed frequency are the same, which would be ideal when assessing reliability.
In Figure 5 below, the reliability diagram for the October to December temperature forecasts show some forecast overconfidence (lines lying below the perfect forcast line, indicating that a category is observed less often than the forecast probability) and very little underconfidence (lines lying above the perfect forecast line, indicating that a category is observed more often than the forecast probability), depending on the category and probability. However, these differences are less than 10% (or 0.1) for the below normal blue line, meaning the below normal forecast probabilities can be considered reliable. These results are contrary to the above normal red line, where the forecast probability between 0.5 and 0.65 (x axis) has much less reliability because the corresponding observed frequencies are between 0.35 and 0.5 (a 10% or greater difference). Furthermore, there is no skill of the above normal forecast probability between 0.5 and 0.6, as the red line falls outside the grey shaded area. In contrast, Figure 6 demonstrates high reliability for all categories and probabilities because the coloured lines deviate by less than 10% from the perfect forecast line.
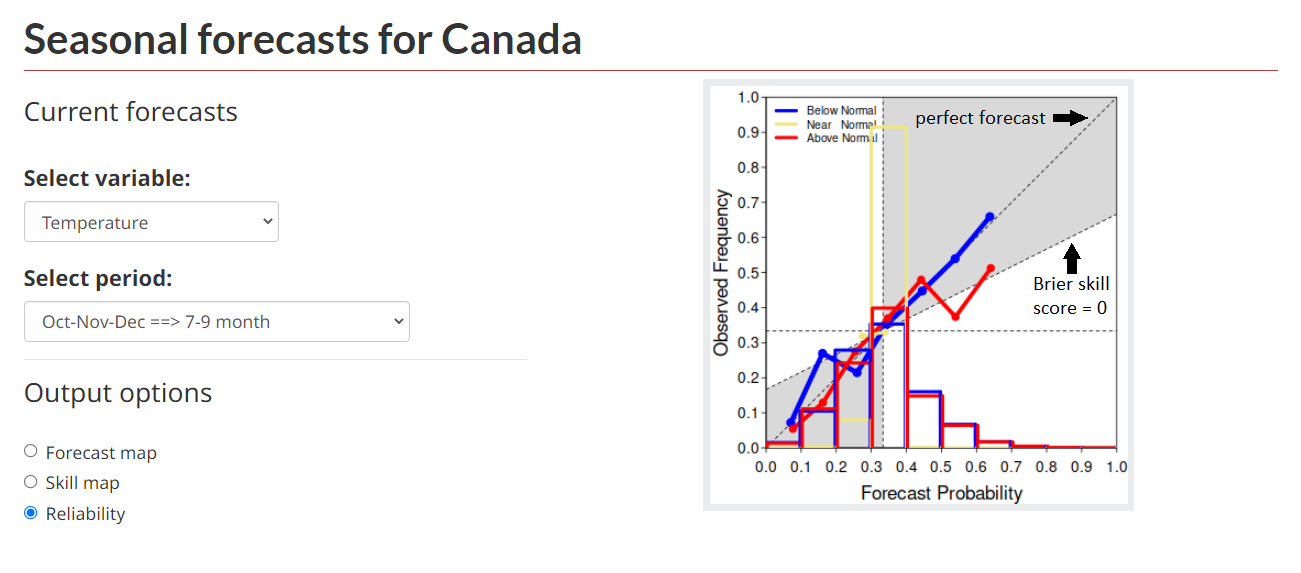
Figure 5. Reliability diagram for the October 2022 to December 2022 seasonal temperature forecast for all locations in Canada. The time between when the forecast was created and when the forecast starts is 6 months (lead time). Forecast probabilities are compared to observed frequencies, with the most reliable forecasts lying closest to the perfect forecast line. The grey shaded area indicates where there is skill.
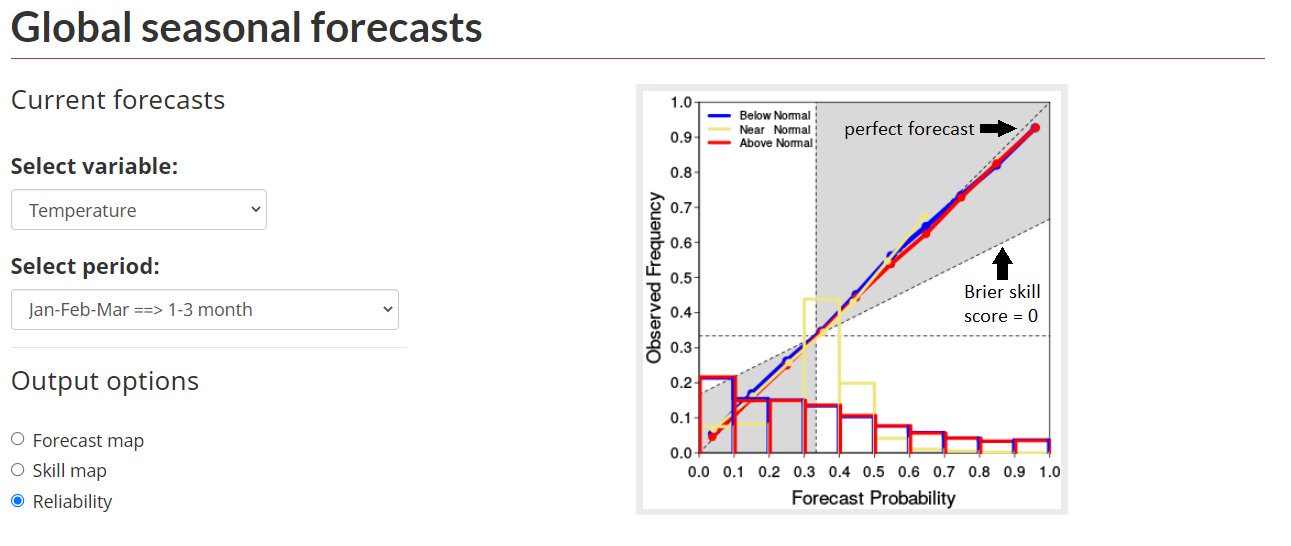
Figure 6. Reliability diagram for the January 2022 to March 2022 seasonal temperature forecast for all locations globally. The time between when the forecast was created and when the forecast starts is 0 months (lead time). Forecast probabilities are compared to observed frequencies, with the most reliable forecasts lying closest to the perfect forecast line. The grey shaded area indicates where there is skill.
4. What is the climatology of the region?
In the context of the seasonal probabilistic forecast, climatology is defined as the average temperature or precipitation for a 3-month period at a specific location. The climatological average is generated from 30 years of station data and makes up the historical reference for which above, below, or near normal probabilities can be created. Users should evaluate the forecast by considering probability, skill, reliability, and the climatology of the region of interest. If a forecast is not skillful or reliable, it may be better to base decisions on climatological probabilities (33% chances of above, below, and near normal).
Variables available
The following variables are available as seasonal forecasts:
- Temperature
- The surface air temperature forecast predicts the anomaly (the difference between the average tempature over the historical reference period and temperature at the time of interest) of the mean daily temperature at 2 meters. It is not a forecast of the maximum or the minimum daily temperature.
- Precipitation
- Sea surface temperature
- Snow water equivalent
- The amount of water contained within snow.
- Surface solar radiation
- The sun's radiation hitting the surface of the earth.
- Cloud fraction
- The coverage of clouds.
- Specific humidity
- The amount of water vapour in the air.
Much of the information on this page is based on the guidance document from the Meteorological Service of Canada (MSC). For more information on how these forecasts are produced, visit the technical notes.
Examples of how seasonal probabilistic forecasts can be used
Example 1: palm oil importer
Note: This example is purely for educational purposes and is entirely fictional and highly simplified. Decisions are based exclusively on the seasonal forecast.
Background scenario
Company A is a Canadian business that relies on importing palm oil from Malaysia (a major exporter) and wants to assess how palm oil production might be impacted by El Niño (the warm phase of the El Niño–Southern Oscillation). During El Niño, droughts tend to occur more frequently in Malaysia, reducing palm oil production.Reference5Reference6 If crop yields decrease, Company A would need to seek an alternative supplier and prepare for a potential price increase. Since the El Niño–Southern Oscillation tends to reach peak intensity in the late autumn or winter (typically November to February)Reference7, Company A is using two forecasts to capture all of the peak months. Company A has determined to take action at the beginning of October if the seasonal forecasts for October-November-December or January-February-March indicate a 50% or greater probability of below normal precipitation. Their acceptable level of skill is 40% or greater (medium or high).
Data summary
Company A reviews the global seasonal precipitation forecast for a representative location in peninsular Malaysia for the two periods, their skill, and reliability. Table 1 summarizes the resulting data.
Table 1. Fictional forecasts for mean precipitation, skill, and reliability for a location in peninsular Malaysia. Fictional lead time: 0 months (October to December) and 3 months (January to March).
| Period | Precipitation forecast | Forecast skill | Forecast reliability |
|---|---|---|---|
|
Oct-Nov-Dec (1 to 3 month) |
Above: 29% Normal: 33% Below: 38% |
63% (high) | The blue below normal line at approximately 38% (0.38) forecast probability is within 10% of the grey diagonal “perfect forecast” line (where observed frequency and forecast probability are the same) |
|
Jan-Feb-Mar (4 to 6 month) |
Above: 10% Normal: 22% Below: 68% |
47% (medium) | The blue below normal line at approximately 68% (0.68) forecast probability is within 10% of the grey diagonal “perfect forecast” line (where observed frequency and forecast probability are the same) |
Interpretation of data
The October-November-December forecast did not meet the requirements laid out by Company A because the probability for below normal precipitation was less than 50%. However, the January-February-March forecast shows a 68% probability for below normal precipitation and satisfies both criteria of 50% or greater forecast probability and 40% or greater skill (47%). With the forecast also being reliable, Company A decides to take action in anticipation of a reduced supply of palm oil and higher prices that might occur three months from when this decision was made. They will also consider reviewing their action plan when a new forecast is issued closer to January.
Example 2: solar energy
Note: This example is purely for educational purposes and is entirely fictional and highly simplified. Decisions are based exclusively on the seasonal forecast.
Background scenario
A solar farm (Company B) located in rural southeastern Alberta is contemplating increasing the number of solar panels, given the higher demand for energy in the previous summer. Company B wants to know if their investment in more solar panels will have some early returns for the upcoming summer season, which partially depends on higher temperatures driving up energy demand. Since Company B needs to start building new panels ahead of the summer season, it decides to check the forecast on March 1st when the summer forecast with a lead time of 3 months is released. If there is a 60% probability that the mean summer temperature will be above normal, Company B will consider making the investment and increasing production ahead of the summer. Since the farm’s location is not listed in the table below the forecast maps, the mouse cursor is used to locate the approximate area of interest on the map. To assess what temperature threshold constitutes above normal, Company B looks up the climatology of the closest major city (Medicine Hat) with a record.
Data summary
Company B reviews the climatology, seasonal temperature forecast for Canada, skill, and reliability. Table 2 summarizes the resulting data.
Table 2.Climatology for Medicine Hat, Alberta, and fictional summer forecast for mean temperature, skill, and reliability for a southeastern area of Alberta. Fictional lead time: 3 months.
| Climatology | Summer forecast | Summer forecast skill | Summer forecast reliability |
|---|---|---|---|
|
18.25 °C Threshold: 0.47 °C |
Above: 68% Normal: 25% Below: 7% |
38% (low) | The red above normal line at approximately 68% (0.68) forecast probability is within 10% of the grey diagonal “perfect forecast” line (where observed frequency and forecast probability are the same) |
Interpretation of data
Based on the climatology, an above normal summer would be any mean temperature above 18.72 °C (18.25 °C + 0.47 °C). The above normal forecast is considered confident because its probability is 68% (greater than 60%). However, given the long lead time of 3 months, the skill has reduced to a level that is not considered skillful (less than 40%). It may be better for Company B to wait another month to see if the summer forecast with a shorter lead time has higher skill to justify placing trust in a high above normal probability. Due to the low skill, the decision would be not to expand operations based on this forecast.
Example 3: ice hotel
Note: This example is purely for educational purposes and is entirely fictional and highly simplified. Decisions are based exclusively on the seasonal forecast.
Background scenario
Company C owns an ice hotel in Iqaluit and wants to evaluate extending operations into the spring. The decision to stay open is feasible and profitable if the seasonal mean temperature does not exceed -12 °C. Based on an analysis of cost, Company C has decided that it will close should the average spring temperature have a 50% chance or higher of being warmer than -12 °C and will remain open if the chance is lower than 50%. The decision is being made on March 1st, when the spring forecast with the shortest lead time (0 months) is released.
Data summary
Company C reviews the climatology, seasonal temperature forecast for Canada, skill, and reliability. Table 3 summarizes the resulting data.
Table 3.Climatology for Iqaluit, Nunavut, and fictional spring forecast for mean temperature, skill, and reliability. Fictional lead time: 0 months.
| Climatology | Spring forecast | Spring forecast skill | Spring forecast reliability |
|---|---|---|---|
|
-12.96 °C Threshold: 0.99 °C |
Above: 54% Normal: 28% Below: 18% |
40% (medium) | The red above normal line at approximately 54% (0.54) forecast probability is within 10% of the grey diagonal “perfect forecast” line (where the observed frequency and the forecast probability are the same) |
Interpretation of data
With a climatology of -12.96 °C, a mean temperature above -11.97 °C (-12.96 °C + 0.99 °C) would be classified as above normal in the forecast, whereas a mean temperature below -13.95 °C (-12.96 °C - 0.99 °C), would be classified at below normal. In this case, the forecast indicates a probability of 54% that the mean temperature for spring will be above -12 °C (rounding from -11.97 °C). The forecast probability of 54% is less confident compared to higher probabilities. The 54% probability is also very close to the criteria set out by Company C of 50%. When considering the skill of medium (40%), the forecast narrowly makes the cut-off criteria of being considered skillful. The forecast is deemed reliable since the above normal line near 54% forecast probability is within 10% of the dashed diagonal line.
Although Company C’s criteria for closing are marginally met, this forecast might require more considerations, depending on the company’s risk tolerance. If Company C instead based their decision on climatology with an equal chance of all three categories occurring (33% chance of below, near, and above normal), as is advisable when skill is low, the choice would be to remain open for the remainder of the spring season since there would be a 66% chance that the forecast is normal (between -11.97 °C and -13.95 °C) or below normal (less than -13.95 °C).