
Climate-Resilient Buildings And Core Public Infrastructure Report: Plain language summary
PDF version of summary
Contents
- Executive summary
- Background
- Objective of this document
- Primary report contents
- Primary report methodologies
- Frequently asked questions
-
Examples
- How many heating degree days will Toronto, Ontario, experience under 3.0°C of global warming?
- How will the average magnitude of 1-in-50-year daily rain events change in Kamloops, BC by the 2070s, under RCP 6.0?
- How will the average magnitude of Prairies 1-in-20-year ice accretion change by the 2060s, under RCP 8.5?
- Glossary
- List of CRBCPI variables Footnotes
1. Executive summary
This document provides a general summary of the “Climate-Resilient Buildings and Core Public Infrastructure: an assessment of the impact of climate change on climatic design data in Canada” (CRBCPI) report.Reference 1 The CRBCPI report itself provides estimates of future Canadian temperature, precipitation, moisture, wind, and snow and ice conditions that are relevant to the National Building Code of Canada (NBCC) and the Canadian Highway Bridge Design Code (CHBDC). It also describes the climate modelling and analysis methods used to develop this information.
All of the climate information in the CRBCPI report has been assigned a level of confidence (there are three tiers) to guide appropriate use. Changes to Canadian conditions are presented in terms of levels of global warming but can also be related to specific emission scenarios and future time frames if needed. Interpretation and application of this information – both in the context of engineering design, and broader use – should reflect these considerations and be integrated into a climate change risk management process for maximum benefit.
The selection of design values of climatic parameters should always be made following appropriate codes and standards. It is important to note that it remains the responsibility of the users of these climatic data to determine whether it is suitable for their particular purpose.
2. Background
Climate change presents a threat to Canada’s buildings and core public infrastructure, because it will intensify a range of weather and climate impacts that could be associated with decreased building and infrastructure performance, and potentially even damage or failure. However, weather and climate measures (‘climatic design variables’) in current design codes and commentaries – foundations of buildings and public infrastructure design – are based only on past climate observations, and do not take future climate change into account.
Recognizing this gap, the National Research Council (NRC) and Environment and Climate Change Canada (ECCC), initiated a program to update the climatic design variables within the National Building Code of Canada (NBCC) and the Canadian Highway Bridge Design Code (CHBDC). These updated climatic design variables are expected to enter widespread use via upcoming 2024/2025 NBCC and CHBDC revisions. The “Climate-Resilient Buildings and Core Public Infrastructure: an assessment of the impact of climate change on climatic design data in Canada” report and related data tables (the ‘CRBCPI report’) are how these methods and updated climatic design variables have been reported. The primary audience of the CRBCPI report are the NBCC and CHBDC code development committees and associated working groups who are responsible for codes updating efforts. However, broader interest in the contents of this report is expected from other engineers, and other sectors and interest groups.
3. Objective of this document
The objective of this document is to provide a relatively plain-language translation of the CRBCPI report. The scientific and technical methods used to develop climate change information in the CRBCPI report (Figure 1) are novel. As a result, it may be difficult for readers who are not climate experts to understand the CRBCPI report methods and/or interpret the report’s information and data. This document intended to reduce these barriers, and bridge the gap between the full technical report and the brief CRBCPI report overview.
This document does not replace the CRBCPI report as a basis for decision-making. Rather, it is intended to support decision makers so that they can more confidently navigate and interpret the primary CRBCPI report itself. To support this goal, links to the primary CRBCPI report text are included where appropriate. When technical terms are used, they are italicized to indicate that a brief definition exists in this document’s glossary.
4. Primary report contents
The CRBCPI report describes estimated future change factors for number of climatic design variables used in the NBCC and CHBDC codes (Section 9; CRBCPI report Appendix 1.2).
Climatic design variables are grouped into four broad classes: temperature (CRBCPI report Chapter 3); precipitation and moisture (CRBCPI report Chapter 4); wind (CRBCPI report Chapter 5); and, snow and ice (CRBCPI report Chapter 6). For each variable, the CRBCPI reports provides:
- A ‘state of science’ assessment (for similar variables, one common assessment is provided);
- A description of any research and analysis performed specifically for the CRBCPI report (for similar variables, one common description is provided);
- An assignment of variable confidence, based on the state of science and CRBCPI-specific research and analysis;
- Change factors that estimate the shift in conditions between future periods and a standard 1986-2016 baseline period. These factors must be added/multiplied to appropriate baseline values to determine future climatic design variable absolute values, and are provided forReference 2 :
- Several Canadian regions:
- British Columbia
- Prairies
- Ontario
- Quebec
- Atlantic
- North
- All of Canada
- 675 pointwise locations corresponding to Canadian cities and towns (CRBCPI Appendix 1.2)
5. Primary report methodologies
Understanding how to apply key CRBCPI report information – specifically, change factors for NBCC and CHBDC climatic design variables – requires a reasonable understanding of the methods used to develop this information (Figure 1). The following sub-sections outline these methods, with a focus on steps that are relatively unique to the CRBCPI report.
5.1 Confidence tiers of climatic design variables
Confidence tiers were developed and assigned to each CRBCPI climatic design variable change factor to guide appropriate use.
All regional-scale projections of climatic design variable change factors are assigned a confidence tier (CRBCPI report Section 1.2), intended to guide use in decision-making (Table 1). The confidence tier of each variable reflects the expert understanding of CRBCPI report authors around:
- State of scientific knowledge
- Ability to simulate the design variable in global climate models
- Ability to apply the design variable at regional scales
- Uncertainty in future projections related to:
- Use of different climate models
- Natural internal variability or ‘noise’ in the climate system
These factors are described for each variable in the CRBCPI report. Importantly, confidence tiers do not reflect:
- The potential range of future conditions related to future human activities, as reflected in Representative Concentration Pathway (RCP) emissions scenarios.
- Confidence in change factors at local scales, such as those provided for Canadian cities and towns. Confidence for these values are lower than confidence in regional values because of natural weather and climate ‘noise’ at local scales (which makes it harder to detect the climate change signals). Confidence is also lower because it is difficult for regional modelling to capture small-scale but often important local factors and climate processes.
Three confidence tiers are defined:
- Tier 1: Confidence is highest for Tier 1 (high confidence) variables, for which ‘specific values of these change factors could be considered when designing new infrastructure’. More generally, change factors for these variables could – with care – be used directly in detailed risk assessments and adaptation planning.
- Tier 2: Confidence decreases for Tier 2 (medium confidence) variables, which are ‘more suitable for cost/benefit analyses or for a risk analysis, as well as for the exploration of uncertainty associated with design’. More generally, change factors for these variables could be used for general risk assessments or general ‘framing’ evaluations of future change.
- Tier 3: Confidence is lowest for Tier 3 (low confidence) variables, for which direct use is discouraged. Instead, they ‘are likely best suited to exploring the potential impacts of climate change on structural reliability in different warming and load combination scenarios’. More generally, change factors for these variables should only be used in an exploratory manner for regional-level climate change assessments.
Table 1: Data assigned to confidence tiers; tier 1 (green), tier 2 (orange), and tier 3 (red).
| Temperature | Precipitation | Ice and Snow | Wind |
|---|---|---|---|
| Max. mean daily air temperature | Annual total precipitation | Ice accretion thickness (1/20) | Hourly wind pressures (1/10) |
| Min. mean daily air temperature | Annual rain | Permafrost extent | Hourly wind pressures (1/25) |
| Annual mean air temperature | 15 min rain (1/10) | Rain load (1/50) | Hourly wind pressures (1/50) |
| Design temperatures January 1% | One day rain (1/50) | Snow load (1/50) | Hourly wind pressures (1/100) |
| Design temperatures January 2.5% | Relative humidity | Driving rain wind pressure (1/5) | |
| Design temperatures July 2.5% dry | |||
| Design temperatures July 2.5% wet | |||
| Degree days below 18°C |
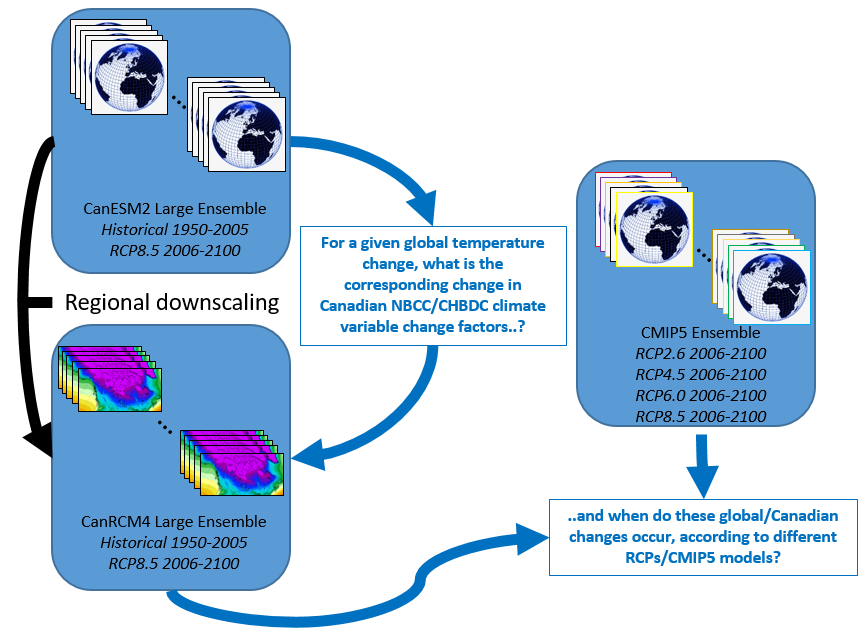
5.2 CanESM2-CanRCM4 regional downscaling
CanRCM4 was used to perform regional downscaling in order to assess regional and local-scale climate change factors.
Downscaling refers to the process of translating global climate model simulation results to high resolution over regions of interest (e.g., Canada). Regional downscaling (also known as ‘dynamical downscaling’, CRBCPI report Section 2.1.5) is a downscaling method that uses high resolution regional climate models (i.e., climate models that don’t cover the entire globe). The CRBCPI report uses a regional downscaling framework (CRBCPI report Section 2.4) that applies the Canadian Regional Climate Model Version 4 (CanRCM4) to regionally downscale Canadian Earth System Model, Version 2 (CanESM2) global climate model results to North America, at ~50 km resolution and relatively frequent time intervals (down to 20 minute increments for some design variables). The resulting CanRCM4-based data provides a ‘zoomed-in’ version of the coarse-scale results produced by CanESM2 simulations. This allows for better regional detail due to increased resolution of (for example) topography, atmospheric circulation patterns and processes, and land surface conditions.
5.3 CanESM2-CanRCM4 large ensemble approach
A large set of global CanESM2 and regional CanRCM4 model simulations were employed to determine regional and local climatic design variable change factors.
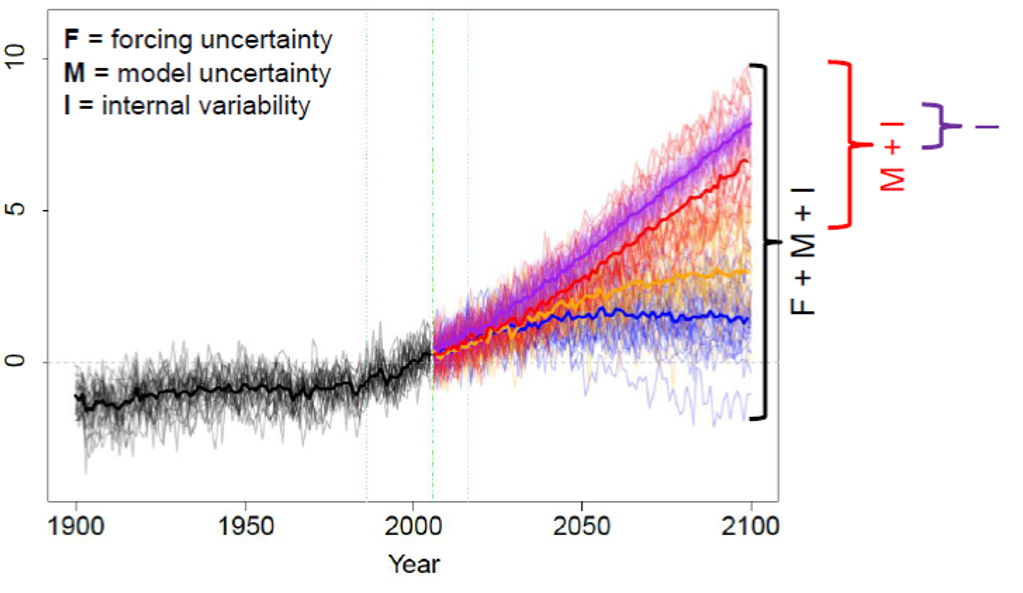
Large numbers of coordinated climate model simulations (‘ensembles’) are important tools for understanding climate change (CRBCPI report Section 2.2). For example (see Figure 2):
- Ensembles of consisting of different climate models run with the same emissions scenario can help describe how choice of climate model impacts estimates of future change (‘model uncertainty; CRBCPI report Section 2.1.2).
- Ensembles of simulations produced by a single climate model using different future emissions scenarios can help describe how different future human actions can influence future climate conditions (‘forcing uncertainty’; CRBCPI report Section 2.1.3).
The well-known Coupled Model Intercomparison Project (CMIP) ensembles are designed to explore each of these two influences on overall future climate projections.
However, CMIP ensembles do not completely address a third important factor: natural variability, also known as climate or weather ‘noise’ (CRBCPI report section 2.1.4). Natural variability ranges from short-term weather to natural patterns like El Nino or the North Atlantic Oscillation. Correctly accounting for natural variability in future climate projections is important for understanding regional climate change. For example, while natural variability simulated by climate models can help understand changes to long-term regional climate conditions (for example, average future temperatures, or likelihood of future extreme precipitation events), the same simulated natural variability should not be used to forecast a specific natural variability ‘event’ (for example, the average temperature or rainiest day of one particular future year). This means that even if there was a ‘perfect’ climate model and the future emissions trajectory was also perfectly known, there would still be uncertainty around future climate change projections due to natural variability.
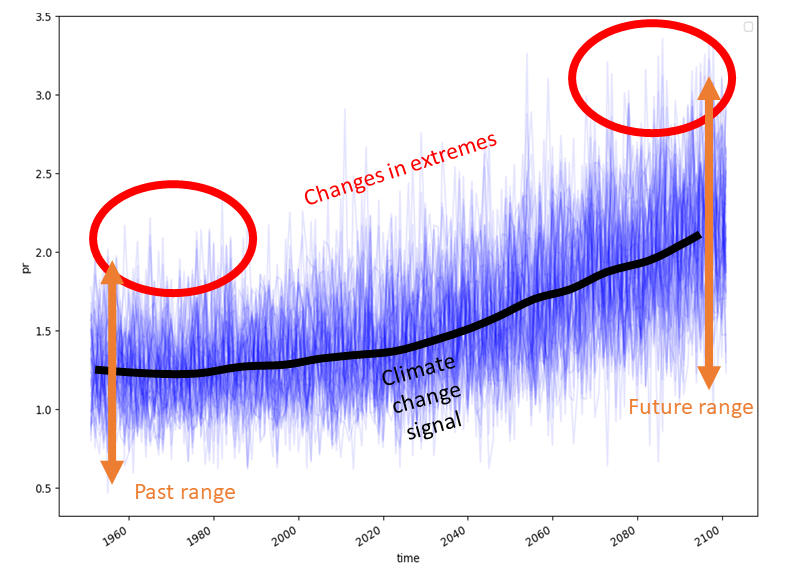
To better understand the role of natural variability, a new framework for carrying out large numbers of climate model simulations, known as a Single Model Initial-condition Large Ensemble (SMILE), has been developed. In SMILEs, the same climate model and emissions scenario are used for each simulation (or ‘ensemble member’). However, at the start of each SMILE, tweaks to climate conditions (for example, extremely small changes to initial cloud distributions) are introduced to very slightly alter each ensemble member’s initial climate conditions. Due to the chaotic nature of short-term weather and climate natural variability, these differences soon grow into a broad spread of conditions across the full climate system (Figure 3). Somewhat counterintuitively, introduction of this controlled ‘natural noise’ to a SMILE is very valuable. This is because the SMILE can then be used (Figure 3) to:
- Understand the full range of past and future climate conditions that could result from natural variability
- More clearly identify signal of human-caused climate change behind the noise of natural climate variability
- Better estimate changes to the chances of occurrence of extreme climate and weather events
Based on the benefits of the SMILE method, it was adopted for the CRBCPI report (CRBCPI report Section 2.2). Fifty simulations of the Canadian Earth System Model, Version 2 (CanESM2) were produced for the high emissions scenario (RCP8.5), according to SMILE principles. To provide an initial tweak, a small difference in initial cloud conditions was introduced on the simulated day January 1, 1950. The resulting SMILE is termed the CanESM2 Large Ensemble (LE). Next, regional downscaling was applied to each LE member, resulting in a set of 50 higher resolution simulations (termed the CanRCM4 LE; CRBCPI report Section 2.4). The CanRCM4 LE dataset is the primary data for development of the NBCC and CHBDC climatic design variable change factors presented in the CRBCPI report.
5.4 Development of warming level-based change factors
NBCC and CHBDC climatic design variable change factors are reported based on different levels of global warming.
A unique aspect of the CRBCPI report is the development of change factors for regional and local Canadian NBCC and CHBDC climatic design variables corresponding to different global annual average warming levels (CRBCPI report Section 2.3). This methodology takes advantage of the CanESM2 and CanRCM4 simulations described above and differs from most climate change reporting, where change is described in relation to specific future time frames and RCP emissions scenarios. Here, Canada-specific changes are linked to different levels (0.5°C to 3.5°C in 0.5°C increments) of annual average global warming (‘ΔT’), relative to a 1986-2016 baseline. The method used to develop this information takes the following steps (also demonstrated graphically in Figure 4):
- CanESM2 LE data is evaluated to find the first 31-year-average period when CanESM LE-simulated global average warming reaches and stays above each of the global temperature change levels described above. These 31-year periods are ‘labelled’ by the middle year of each period.
- CanRCM4 LE downscaled data corresponding to the 31-year period identified in Step 1) are extracted from the full CanRCM4 LE dataset.
- This ‘subset’ of the full CanRCM4 LE data is used to determine regional and local climatic design variable change factors (relative to 1986-2016 CanRCM4 LE baseline conditions). These change factors are presented in the CRBCPI report. They represent CanRCM4 LE regional or local change factors that are consistent with different levels of global average warming.
5.5 Translating from climate change factors to time frames and RCP scenarios
It is possible to determine RCP and time frame-specific future conditions from global average warming level-based CRBCPI reporting.
CRBCPI report readers may need climate change information in terms of specific future time frames (for example, for use in a design that includes specified design lifetimes, or social impacts related to long-term trends). Readers may also need information for different RCP scenarios (for example, to provide a range of future impact likelihoods for risk assessments). Finally, it may be preferable to relate CanRCM4 results to the range of global changes produced by the full suite of CMIP5 models.
A ‘translation method’ for converting from global temperature-based changes to scenario, model, and timeframe-specific changes is described in the CRBCPI report (CRBCPI report Section 2.5.1; Table 2.1; CRBCPI report Appendix 1.1). This translation occurs via the following steps (demonstrated in examples available in Section 7; step numbering corresponds to that shown in Figure 4):
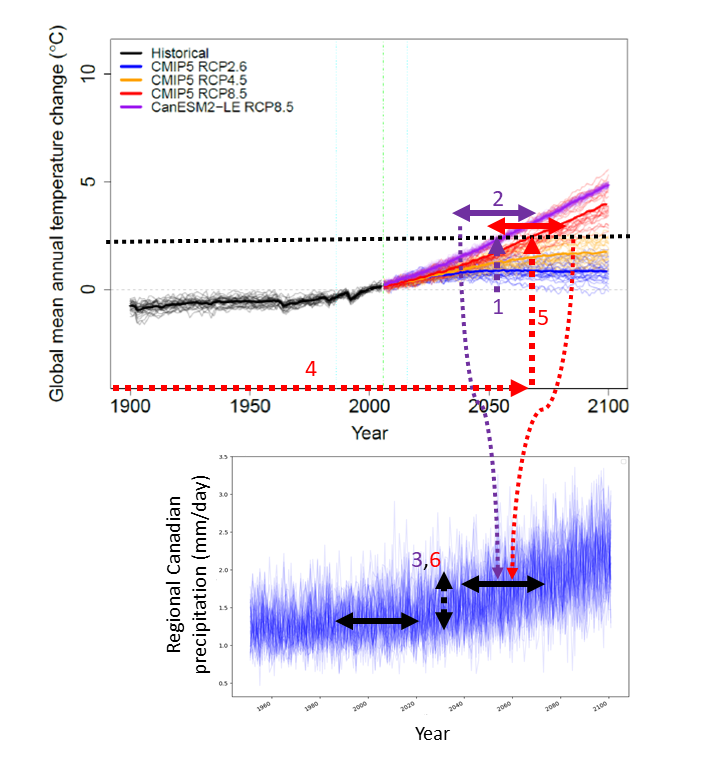
- The future time frames and RCP scenarios for decision-making are identified by decision makers. Choosing time frames and RCP scenarios requires risk-based discussions that should occur prior to CRBCPI report data analysis.
- The column of Table 2.1 with a header corresponding to the RCP scenario chosen in Step 1) is identified.
- The row containing the year nearest to the time frame chosen in Step 1) is identified from within the column identified in Step 2. The value of the header of this row identifies the temperature change level for the identified time frame and RCP scenario.
The timing of temperature changes for each RCP scenario provided in Table 2.1 are determined using the RCP 8.5 temperature trend of the entire CMIP5 model ensemble. However, some models within this ensemble warm faster than average, so that global temperature and regional Canadian change factors are reached sooner than described in Table 2.1. Appendix 1.1 allows for an assessment of this upper bound, by providing a table similar to Table 2.1 but for the upper quartile of CMIP5 model ensemble results, that focus on more rapidly-warming models. If the upper bound of change for more sensitive climate models is needed (e.g. for risk assessment), Appendix 1.1 should be used instead of Table 2.1.
Table 2.1 and Appendix 1.1 provide years at which the specific global warming levels at 0.5°C increments are reached (for 31-year intervals centred on the given year). Within a given RCP scenario, substantial time can pass before the next 0.5°C warming increment is reached. If climatic design variable change factor information is needed for an interim period (referenced by a central year), the method described above can be used to assess conditions for 1) the closest previous and 2) next ‘bounding’ years to the reference year in question. Then, these two datasets can be averaged using a time-weighted approach to estimate the appropriate interim climatic design variable change factors.
6. Frequently asked questions
-
What climate change information is provided in the CRBCPI report?
The CRBCPI report provides information related to future changes to climatic design variables (‘climatic design variable change factors’) reflecting temperature (CRBCPI report Chapter 3); precipitation and moisture (CRBCPI report Chapter 4); wind (CRBCPI report Chapter 5); and, snow and ice (CRBCPI report Chapter 6). All climatic design variables are listed in CRBCPI report Appendix 1.2 and Table 1 of this document.
-
How were specific climatic design variables chosen for inclusion in the CRBCPI report?
Climatic design variables included in the CRBCPI report were chosen based on their use in the National Building Code of Canada and the Canadian Highway Bridge Design Code.
-
Which Canadian regions and locations does the CRBCPI report provide climate change information for?
The CRBCPI report provides average climatic design variable change factors for all of Canada, 6 large Canadian regions, and 675 specific Canadian locations listed in Table C-2 of the NBCC. Region-specific change factors are provided in tables throughout the CRBCPI report text and location-specific change factors are provided in CRBCPI report Appendix 1.2
-
How do I interpret regional/local change factors in terms of global temperature change levels, as described in the CRBCPI report?
A regional/local climatic design variable change factor ‘ΔX’ can be interpreted in terms of global annual average temperature increase level ‘ΔT’ as follows: “If the globe were to warm by ΔT, the regional/local climatic design variable would change by ΔX”. This interpretation is described in CRBCPI report Section 2.3 and summarized in Section 5.4 of this document.
-
Why are regional/local change factors described in terms of global temperature change levels in the CRBCPI report?
Describing regional and site-specific climatic design variable change factors in relation to global temperature change levels is an effective approach that disconnects the reported change factors from specific emissions forcing scenarios, time frames, or model sensitivity. Change factors can be translated if needed, using the method described in CRBCPI report Section 2.5.1 and summarized in Section 5.5 of this document.
-
I need the absolute value of a particular climatic design variable, for one RCP scenario and future period. Can I determine this value from the CRBCPI report?
Yes. The absolute value of change for a particular climatic design variable and particular RCP scenario and future period can be determined using the method described in CRBCPI report Section 2.5.1 and summarized in Section 5.5 of this document. Additionally, median and upper-end estimates of change for a particular RCP scenario can be determined. An absolute future value of the same variable can be determined by adding/multiplying the change factor determined by this approach, onto an equivalent regional/location value that is consistent with the 1986-2016 baseline period.
-
How do I interpret the confidence tiers of variables described in the CRBCPI report?
Confidence tiers used in the CRBCPI report are intended to guide appropriate use of CRBCPI qualitative and quantitative information in decision-making. Three confidence tiers of variables (Tier 1: high or very high, Tier 2: medium and Tier 3: low or very low) are described in CRBCPI report Section 1.2 and summarized in Section 5.1 of this document.
-
Why were so many CanESM and CanRCM4 model simulations run?
The ‘large ensemble’ of 50 CanESM global climate model runs, each downscaled via a paired CanRCM4 simulation, allows for better assessment of changes to extreme climate event intensity and likelihood, and a clearer view of uncertainty in future conditions due to natural variability. CanRCM4 regional downscaling is described in CRBCPI report Section 2.4, and summarized in Section 5.2 of this document. The large ensemble approach is described in CRBCPI report Section 2.2 and summarized in Section 5.3 of this document.
-
What are the advantages of pairing CanESM and CanRCM4 simulations?
Coordinating CanESM and CanRCM4 simulations allows for regional Canadian measures of change captured by CanRCM4 simulations to be described in terms of global temperature change levels described by CanESM simulations. The advantages of this approach are summarized in CRBCPI report Section 2.5.1 and summarized in Section 5.5 of this document.
-
What is the difference between the information provided by the CRBCPI report, and information provided by the Pacific Climate Impacts Consortium, ClimateData.ca and the Climate Atlas of Canada?
Information and data provided by the CRBCPI report are based on a large ensemble of simulations from the CanESM2 global climate model (a single model), dynamically downscaled using CanRCM4 simulations. This information is provided in the context of global temperature change increments for several large regions and a number of pointwise locations. Information provided by the Pacific Climate Impacts Consortium, ClimateData.ca and the Climate Atlas of Canada is based on statistically downscaled output of multiple global climate models for multiple RCP scenarios, making use of high resolution gridded historical observations available for temperature and precipitation only.
7. Examples
The following purely hypothetical examples are provided as ‘worked examples’ demonstrating how to apply the information contained in the CRBCPI report. They are intended to demonstrate:
- Relatively simple to relatively complex interpretations of CRBCPI data;
- Calculation of both global temperature-based and RCP/timeframe-based reporting methods;
- Determination of both relative changes, and absolute future values;
- Examples of interpretation of Tier 1, 2, and 3 CRBCPI climatic design variable change factors.
Readers who expect to apply CRBCPI information to their decision-making are encouraged to first familiarize themselves with CRBCPI data interpretation best practices by reproducing these calculations and interpretations.
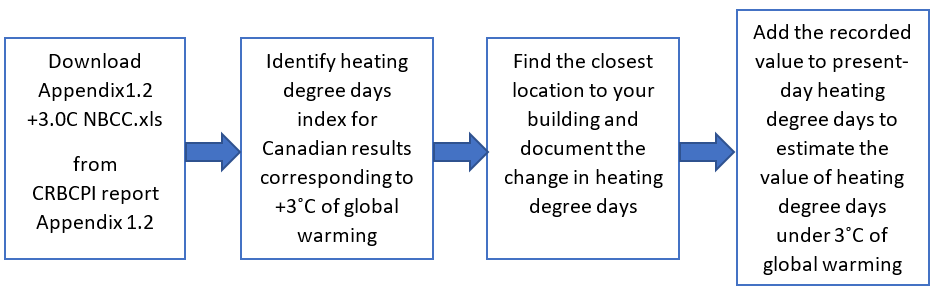
7.1 How many heating degree days will Toronto, Ontario, experience under 3.0°C of global warming?
This case study demonstrates how to determine and apply the value of a Tier 1 climatic design variable for a given level of global temperature change.
A new building is planned for downtown Toronto. The design of this building’s heating system requires an assessment of estimated change in heating degree days (specifically, accumulation of degree days below 18°C) corresponding to a +3°C increase in global temperature. To obtain this value, the building design team should:
- Download the Appendix1.2 +3.0C NBCC.xls Excel spreadsheet using the link provided in the CRBCPI report Appendix 1.2 to obtain Canadian results corresponding to +3°C of global warming;
- Identify the appropriate short name for the heating degree days index [HDD_+3.0C];
- Identify the location closest to the new building location [assume it is Toronto (city hall), 43.6°N,-79.38°W];
- Record the value of the ‘HDD_+3.0C’ column corresponding to change in heating degree days at the Toronto (city hall) row [-1059 days];
- Add this value of heating degree day change to present-day values to estimate the absolute value of the heating degree days experience by the planned building under 3°C of warming [3831-1058=2772 heating degree days; present day value obtained from the Climate Atlas of Canada].
After careful consideration of potential uncertainties, including the lower confidence in CRBCPI report data at point locations, this final Tier 1 number could be potentially used as a basis for preliminary engineering design.
7.2 How will the average magnitude of 1-in-50-year daily rain events change in Kamloops, BC by the 2070s, under RCP 6.0?
This case study demonstrates how to determine and apply the value of a Tier 2 variable for a particular RCP and future time period.
Storm water sewer infrastructure upgrades in Kamloops are hypothetically intended to last for 50 years, i.e. until the early 2070s, assuming upgrades carried out in 2021. Upgrade design requires an estimate of 1-in-50 year daily rain event magnitudes (i.e., daily-scale rain events with a ~2% chance of occurrence each year) for the 2070s. Given risk and budget considerations, the RCP 6.0 climate scenario is chosen as the appropriate scenario for design. To obtain an estimate of 2070s 1-in-50-year daily rain event magnitude for the RCP 6.0 scenario, municipal planners should:
- Use CRBCPI report Section 2.5.1; Table 2.1 to determine the temperature that RCP 6.0 reaches by 2070, for the CMIP5 multi-model mean [+1.5°C];
- Download the Appendix1.2 +3.0C NBCC.xls Excel spreadsheet using the link provided in the CRBCPI report Appendix 1.2 to obtain Canadian results corresponding to +1.5°C of global warming;
- Identify the appropriate short symbol for the 1-in-50-year daily rainfall index [Rn1Day_+1.5C];
- Identify the Kamloops location [Kamloops, latitude 50.67°N, -120.32°W];
- Record the value of the ‘Rn1Day_+1.5C’ column corresponding to Kamloops row [14.7%];
- Increase the present day estimate of 1-in-50-year daily rainfall by 14.7% to arrive at an estimated 2070s value [43 mm*1.147% ~= 49 mm present day value obtained from ClimateData.ca];
- Reflecting climatological period length, use 49 mm as an estimate of typical 1-in-50-year daily rain events, for a 30-year period centered on year 2070;
- Repeat the process of estimating future rainfall for other RCPS surrounding RCP 6.0 (e.g. RCP4.5 and RCP 8.5), for other time periods surrounding the 2070s (e.g. 2050s, 2090s), and for surrounding locations (e.g. Merritt; Vernon; Cache Creek);
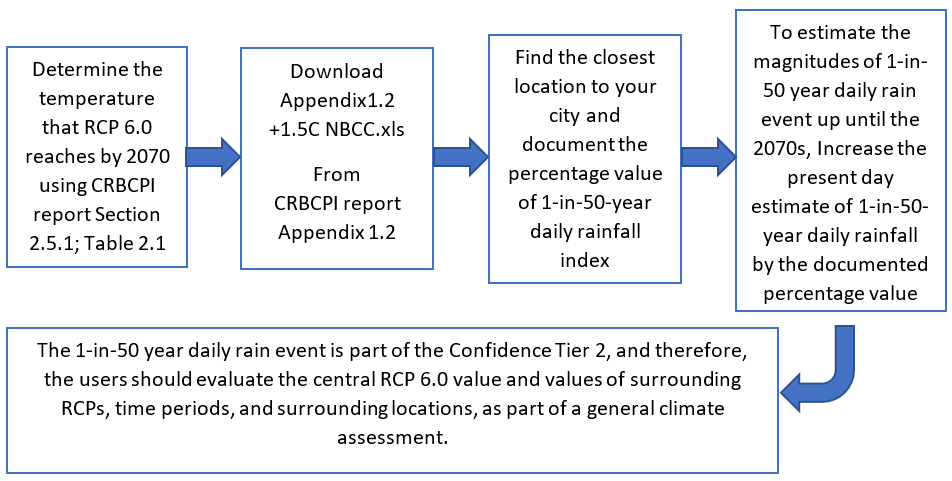
- Reflecting the Tier 2 nature of Rn1Day and low signal-to-noise due to high natural variability (high NS ratio, red text in Appendix1.2 +3.0C NBCC.xls), the central RCP 6.0 value and values for surrounding RCPs, time periods and locations should be collectively evaluated to understand the range of climate change impacts to Kamloops storm sewers. This should be carried out as part of a high-level cost/benefit analysis, with further local-scale studies required to explore specific adaptation actions.
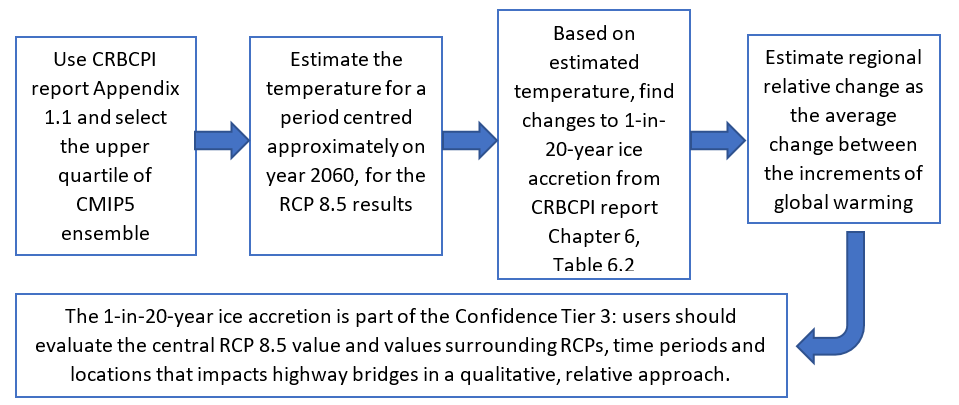
7.3 How will the average magnitude of Prairies 1-in-20-year ice accretion change by the 2060s, under RCP 8.5?
This case study demonstrates how to determine and apply the value of a Tier 3 variable for a particular RCP and time period that lies between reported time periods.
Prairies inter-provincial transportation planners are concerned with the risk of increased ice accretion (freezing rain) on long-lived Prairies bridge superstructures. To assess worst-case scenarios, the higher end of climate model simulated changes to 1-in-20-year ice accretion magnitudes (i.e., heavy freezing rain events with a ~5% chance of occurrence each year) for the RCP 8.5 scenario and a period centred on year 2060 were chosen for a risk assessment. Territorial planners should:
- Use regional Prairies average relative changes to 1-in-20-year ice accretion magnitude instead of site-specific Prairies changes, due to the broad geographic distribution of Prairies highway bridges and substantial uncertainty in local and regional magnitudes of ice accretion change (a Tier 3 variable). Prairies-average changes are available in CRBCPI report Chapter 6, Table 6.2 and are reported for 1°C increments of global warming, up to +3°C;
- Use CRBCPI report Appendix 1.1 for the upper quartile of CMIP5 ensemble results to estimate the temperature for a period centred approximately on year 2060, for the RCP 8.5 results [~+2.5°C];
- For this level of warming, the relative change in Prairies ice accretion for RCP 8.5 for the 2060s period should be estimated as the average of the +2°C and +3°C Prairies regional change values [(27.6%+38.1%)/2~=33%];
- Repeat the process for estimating future Prairies-average ice accretion changes for lower RCPs (e.g. RCP 4.5, RCP 6.0) for other time periods surrounding the 2050s (e.g. 2040s, 2080s), and for surrounding regions (e.g. British Columbia, Ontario, North);
- The final spread of changes developed around the central estimate from RCP 8.5 and the 2060s period should be used in a qualitative, relative fashion to highlight a potentially significantly growing future risk of ice accretion to Prairies highway bridge superstructures. If consequential response plans are forecasted, further local-scale studies should be mandated to explore bridge-specific adaptation plans consistent with (for example) microclimate conditions and present-day ice accretion patterns.
8. Glossary
- Absolute values
- An absolute measure of a particular climatic design variable, such as 25°C, 4 mm of rainfall, or a 50 km/h windspeed. Absolute values should not be confused with change factors or, more generally, difference or anomaly values.
- Change factor
- A measure of change in a particular climatic design variable, represented either in absolute (e.g. 1°C change in temperature) or relative (e.g. 10% increase in precipitation) difference, depending on the nature of the variable in question.
- Climatic design variable
- A measure or indice of weather or climate used in the NBCC or CHBDC. The full list of climatic design variables considered by the CRBCPI is provided in Figure 1 of this document and Appendix 1 of the CRBCPI report.
- Confidence
- In the context of the CRBCPI report, a level of ‘trust’ that can be placed in quantitative factor assessments for particular climatic design variables within the CRBCPI report.
- Downscaling
- The process of obtaining high resolution local estimates of climatic design variables by combining local and/or high resolution information, and large-scale climatic design variables from global climate models.
- Emissions scenario
- A plausible representation of future demographic and socio-economic conditions, that result in projections of future greenhouse gas emissions.
- Ensembles
- Large coordinated groups of climate model simulations, designed to explore and quantify how different emissions scenarios, different, climate models, and natural variability impact projected future climate conditions.
- Natural variability
- Variation in climate conditions caused by natural noise in the climate system, unrelated to human climate influences.
- Resolution
- Level of climate model and gridded observational data granularity. High resolution implies closer spacing between data grid points, either in space or in time.
- Single Model Initial Condition Large Ensemble (SMILE)
- An emerging ensemble framework that parallels weather forecasting approaches and is particularly useful for quantifying the role of natural variability in future climate change projections.
- Uncertainty
- A measure of the degree of certainty around future climate projections, that tends to be inversely related to confidence in these same projections.
9. List of CRBCPI variables
| Variable | Long Name | Units | Confidence | General Description | Code | Metric Type | Statistical Bias Correction/Fitting/Scaling |
|---|---|---|---|---|---|---|---|
| maxTmean | Maximum mean daily air temperatures | °C | Tier 1 | Change in hottest summertime daily temperatures experienced in a year | CHBDC | Temperature | No |
| minTmean | Minimum mean daily air temperatures | °C | Tier 1 | Change in coldest wintertime daily temperatures experienced in a year | CHBDC | Temperature | No |
| AnnTmean | Annual mean air temperature | °C | Tier 1 | Change in annually averaged air temperature | NBCC | Temperature | No |
| TJan10 | Design Temperatures January 1% | °C | Tier 1 | Change in amount of extremely cold wintertime hourly temperatures | NBCC | Temperature | No |
| TJan25 | Design Temperatures January 2.5% | °C | Tier 1 | Change in amount of cold hourly wintertime temperatures | NBCC | Temperature | No |
| TJuly | Design Temperatures July 2.5% dry | °C | Tier 1 | Change in amount of hot summertime temperatures | NBCC | Temperature | No |
| TwJuly | Design Temperatures July 2.5% wet | °C | Tier 1 | Change in amount of hot summertime temperatures, also considering humidity | NBCC | Temperature | No |
| HDD | Degree days below 18°C | °C days | Tier 1 | Change in indice indicative of building heating requirements ('heating degree days') | NBCC | Temperature | Yes |
| AnnP | Annual total precipitation | % | Tier 2 | Relative change in total annual precipitation (rain plus snow) | NBCC | Precipitation and moisture | Yes |
| AnnR | Annual rain | % | Tier 2 | Relative change in total annual rainfall (not snowfall) | NBCC | Precipitation and moisture | Yes |
| Rn15m | 15 min rain (1/10) | % | Tier 2 | Relative change in strong short-duration rain events | NBCC | Precipitation and moisture | Distribution fit; temperature scaling from un-bias-corrected annual average temperature |
| Rn1Day | One day rain (1/50) | % | Tier 2 | Relative change in extremely strong one-day duration rain events | NBCC | Precipitation and moisture | Distribution fit; temperature scaling from un-bias-corrected annual average temperature |
| iceThick | Ice thickness (1/20) | % | Tier 3 | Relative change in severe freezing rain events | CHBDC | Snow and ice | Distribution fit |
| Q10 | Hourly wind pressures (1/10) | % | Tier 3 | Relative change in strong hourly wind events | CHBDC/NBCC | Wind | Distribution fit to un-bias-corrected 20 minute wind speeds |
| Q25 | Hourly wind pressures (1/25) | % | Tier 3 | Relative change in very strong hourly wind events | CHBDC/NBCC | Wind | Distribution fit to un-bias-corrected 20 minute wind speeds |
| Q50 | Hourly wind pressures (1/50) | % | Tier 3 | Relative change in extremely strong hourly wind events | CHBDC | Wind | Distribution fit to un-bias-corrected 20 minute wind speeds |
| Q100 | Hourly wind pressures (1/100) | % | Tier 3 | Relative change in historically strong hourly wind events | CHBDC | Wind | Distribution fit to un-bias-corrected 20 minute wind speeds |
| DRQ | Driving rain wind pressure (1/5) | % | Tier 3 | Relative change in strong hourly rain-plus-wind events | NBCC | Wind | Distribution fit to un-bias-corrected hourly wind speeds in presence of >1.8 mm/hr rainfall |
| RH | Relative humidity | % | Tier 3 | Relative change in atmospheric humidity | NBCC | Precipitation and moisture | No |
| SLr | Rain load (1/50) | % | Tier 3 | Relative change in extremely strong rain events over snow - a measure of rain-on-snow events | NBCC | Snow and ice | Distribution fit to annual un-bias-corrected maximum for rain in presence of snow |
| SLs | Snow load (1/50) | % | Tier 3 | Relative change in extremely heavy snowpacks, including the effects of rain-on-snow events | NBCC | Snow and ice | Distribution fit to annual un-bias-corrected maximum |
| n/a | Permafrost extent | % | Tier 3 | Change in northern Canada near-surface permafrost extent | NBCC/CHBDC | Snow and Ice | No |