
CMIP6 climate scenarios
Coupled Model Intercomparison Project Phase 5 (CMIP5) scenarios are also available
Climate scenarios from the Coupled Model Intercomparison Project Phase 6 (CMIP6) global climate models (GCMs), whose results were used in the latest Intergovernmental Panel on Climate Change (IPCC) Assessment Report (AR6), are available. CMIP6 projections are based on the Shared Socio-economic Pathway (SSP) scenarios. For more information on CMIP6 and SSPs, please see the overview. The IPCC's interactive atlas offers regional information on projected changes in climate using CMIP6 data for the globe.
For a Canadian perspective, the time series graphs, maps, and tabular data presented here are based on a multi-model ensemble of CMIP6 GCMs interpolated to a common 1x1 degree grid. Global gridded formats are available for the multi-model ensembles as well as for individual GCM outputs. Please see the technical notes for more details on atmospheric and sea ice, and ocean variables.
For climate change adaptation purposes (e.g., risk and vulnerability assessments), it is recommended to use higher resolution (downscaled) data. This data is more relevant for local-level decision-making. To access user-friendly data and resources to inform climate change adaptation visit ClimateData.ca. Statistically downscaled climate scenarios and dynamically downscaled datasets are also available. All three websites use climate data produced by Environment and Climate Change Canada.
A subset of CMIP6 daily predictor variables that can be used for statistical downscaling of GCMs are also available for download. For more information on the CMIP6 predictors, please see the technical documentation.
Individual model datasets and all related derived products, including the multi-model ensembles, are subject to the terms of use of the source organization.
Time series
Time series
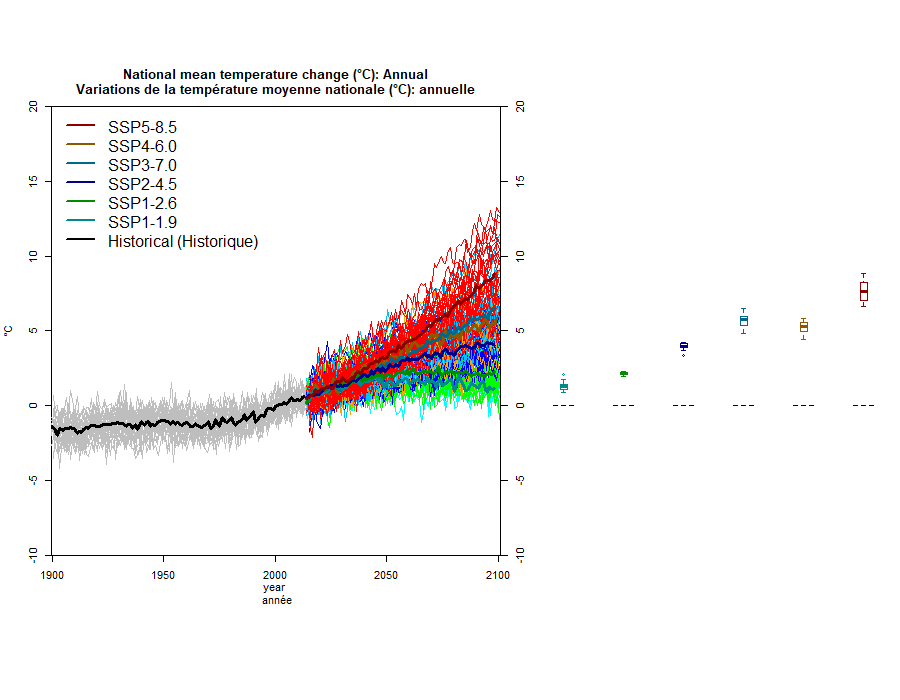
For these global time series datasets, the areal mean is computed on the common 1x1 degree grid. Global multi-model ensemble mean datasets and Canadian plots are available for temperature, precipitation, near-surface wind speed, sea ice concentration, sea ice thickness, and snow depth.
Due to model uncertainty and natural variability, the time series of each model and scenario over the common period 1900‑2100 are shown as anomalies relative to a baseline time period of 1995‑2014. The multi-model ensemble means (bolded) are also shown. While plots compare both the multi-model ensemble means and the results from individual contributing GCMs for Canada (atmospheric variables use only land points in Canada, and ocean variables use only sea points within the region 214.5 to 315.5 degrees East and 35.5 to 89.5 degrees North), only the multi-model ensemble mean is downloadable as a dataset (for the globe).
Finally, for the period 2081‑2100, the 20-year means are computed, and the box-and-whisker plots show the 25th, 50th (median), and 75th percentiles sampled over the distribution of the 20-year means of the model time series to include both natural variability and model spread.
The sea ice concentration ensembles have been updated to include an additional model. This affects all users who downloaded these datasets prior to September 25 2024.
Note: Graphs display only national data and NetCDFs contain the global dataset.
Graph view
Maps
Maps
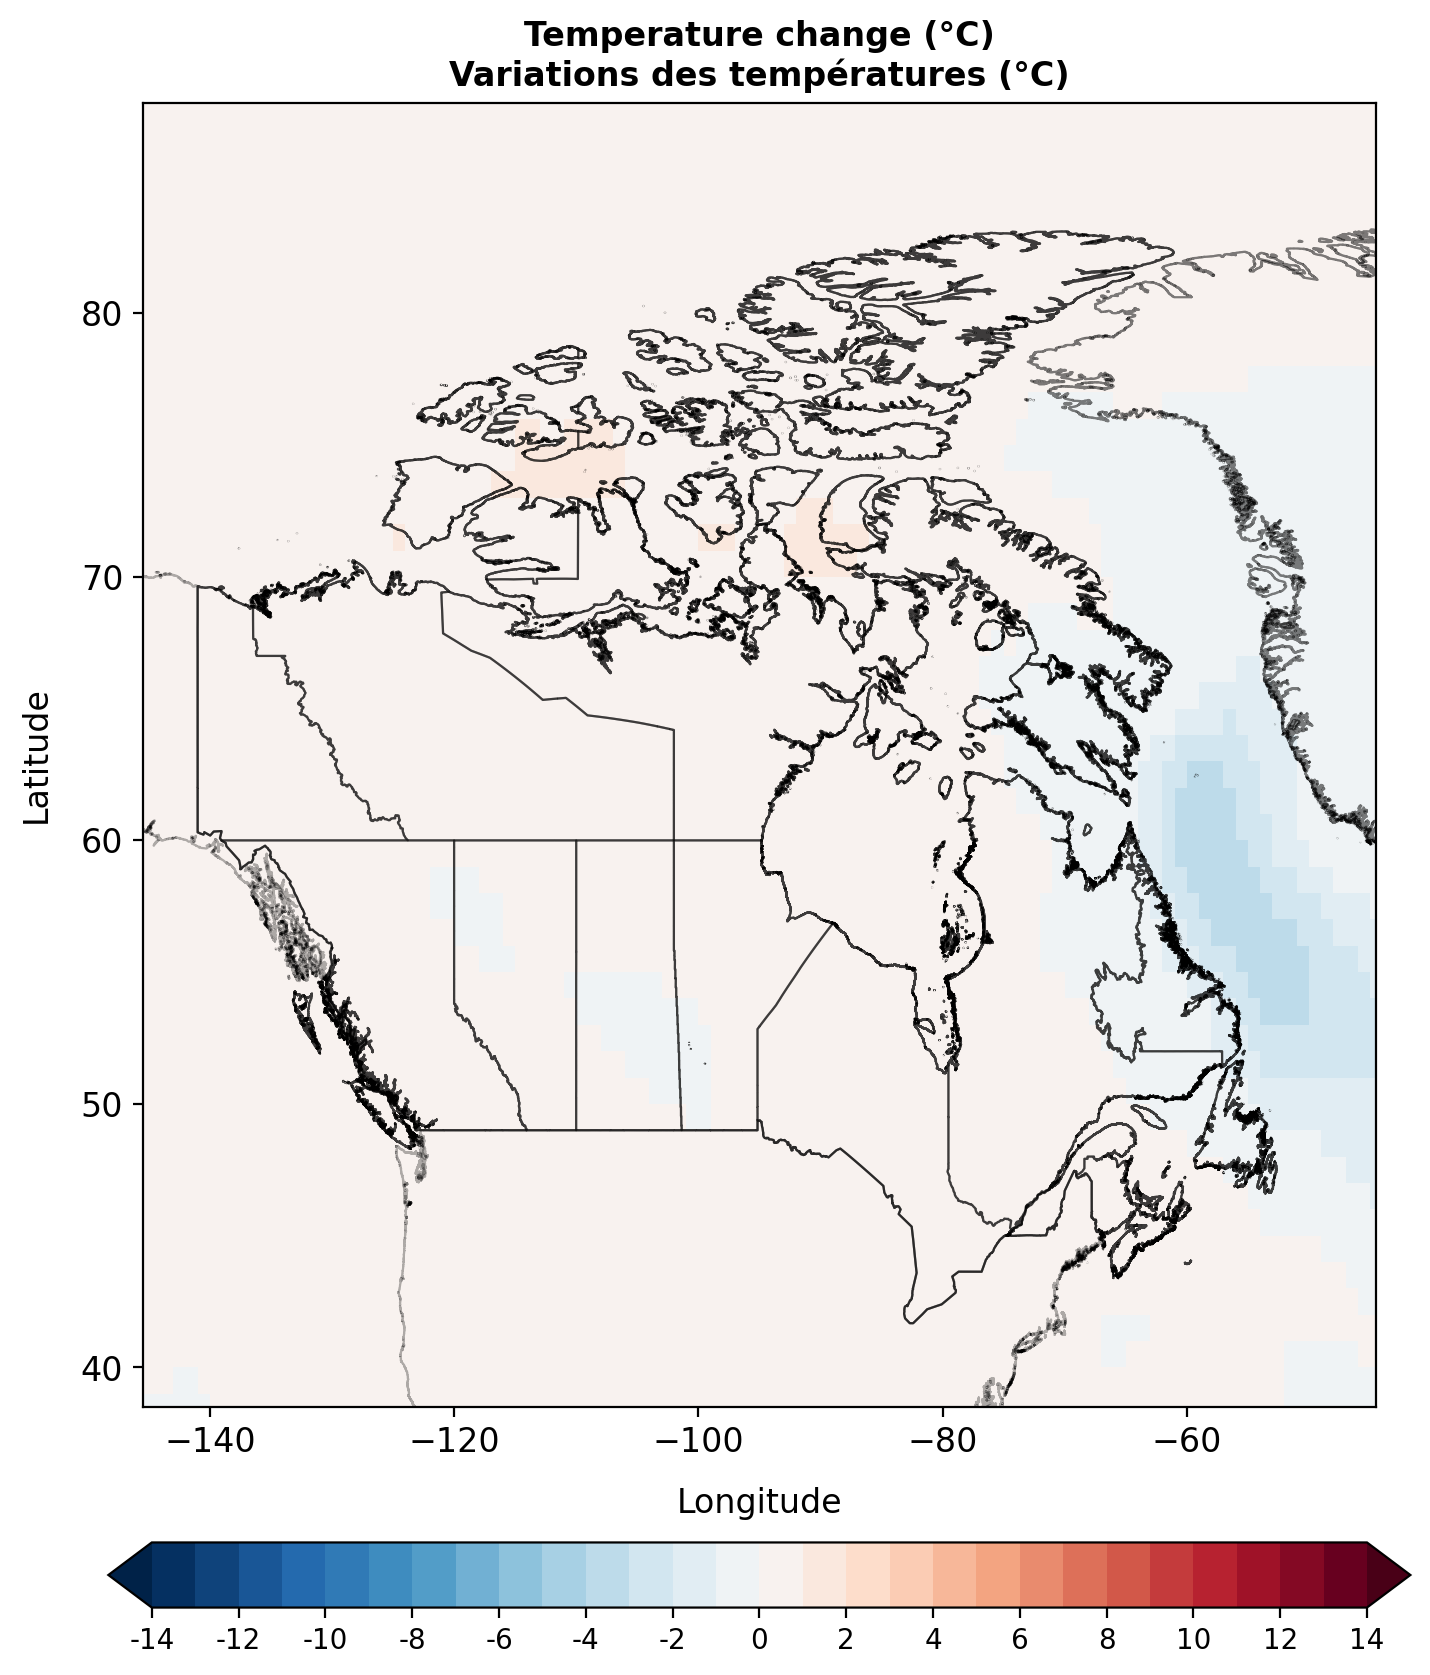
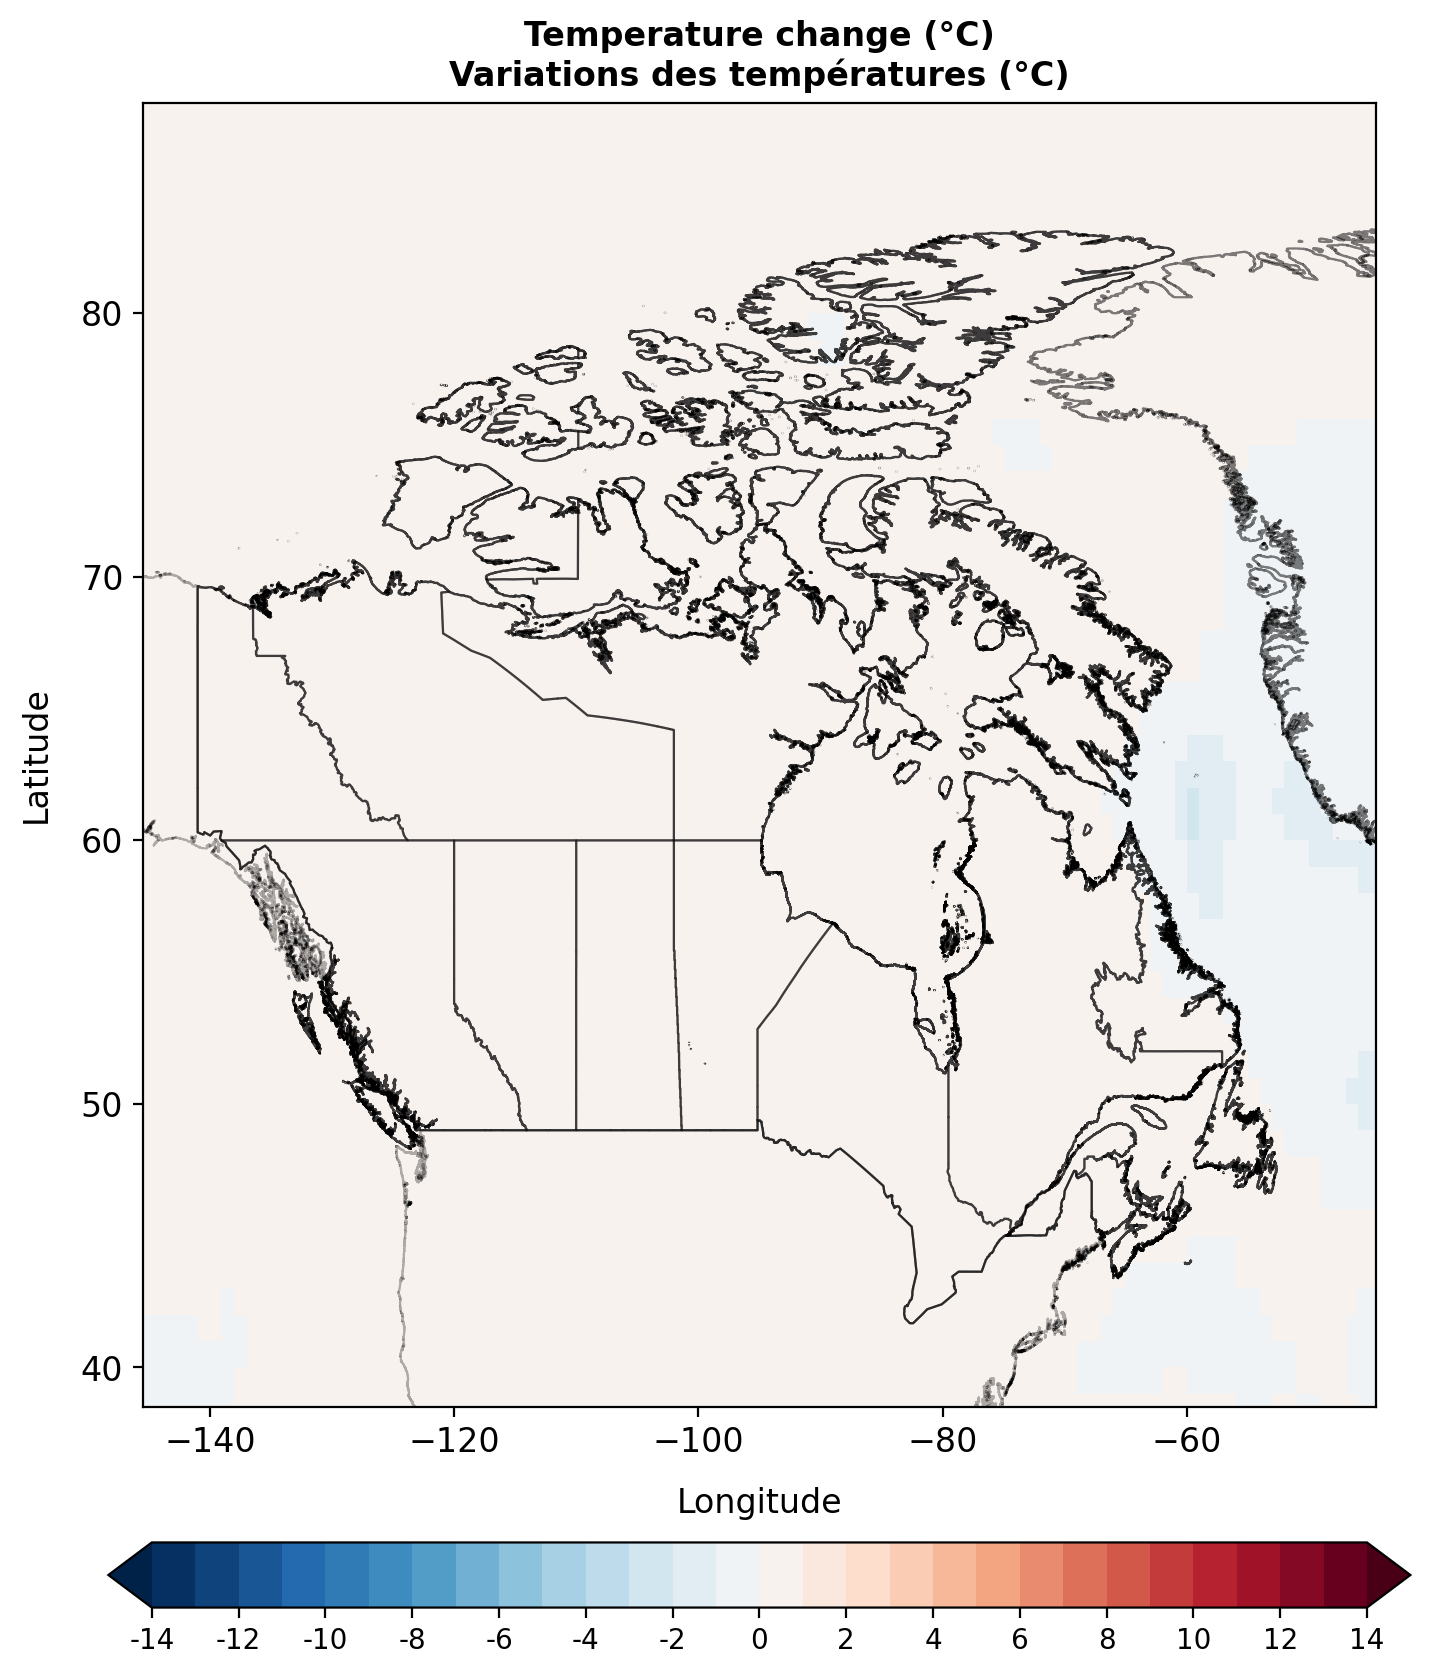
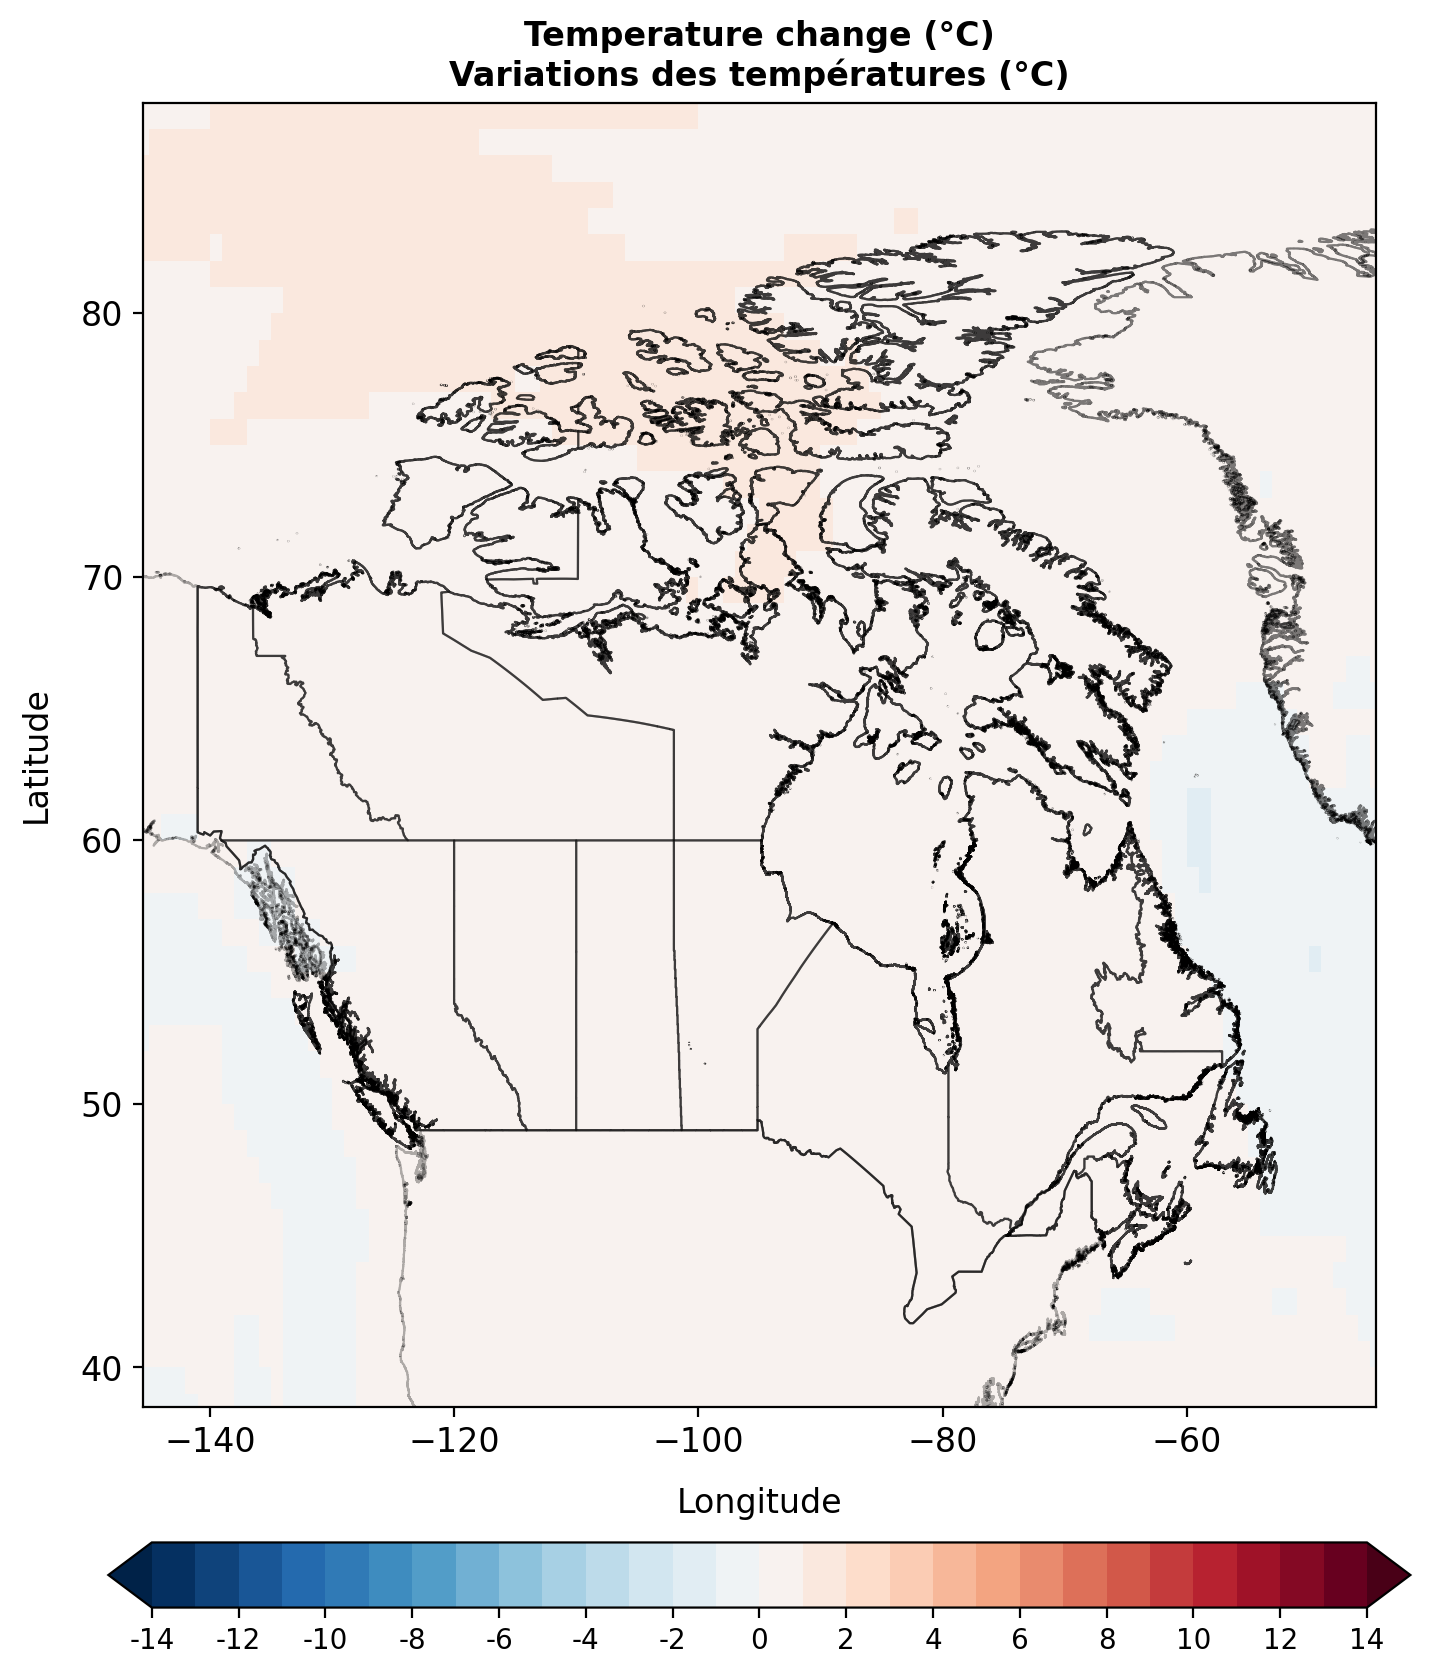
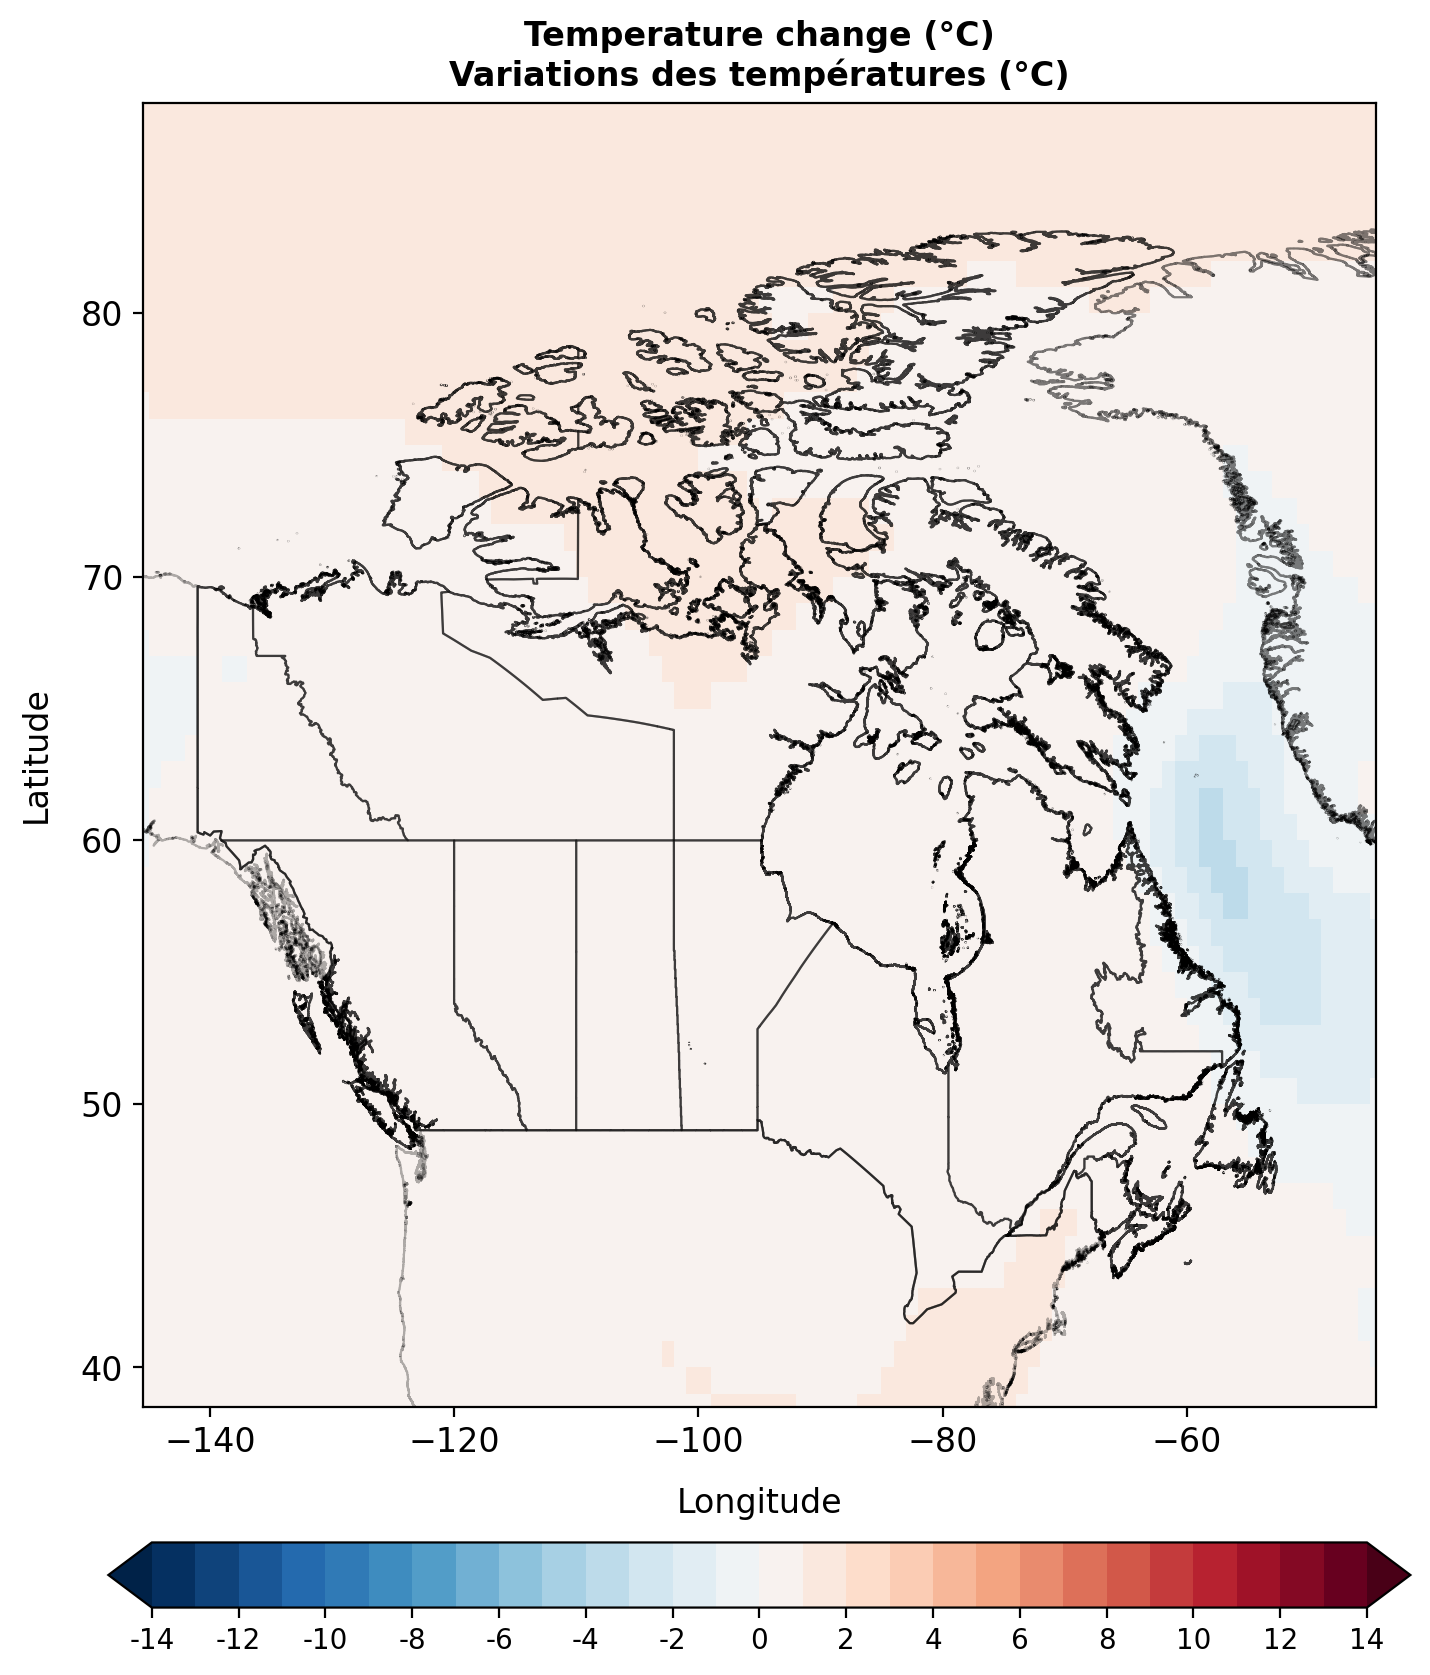
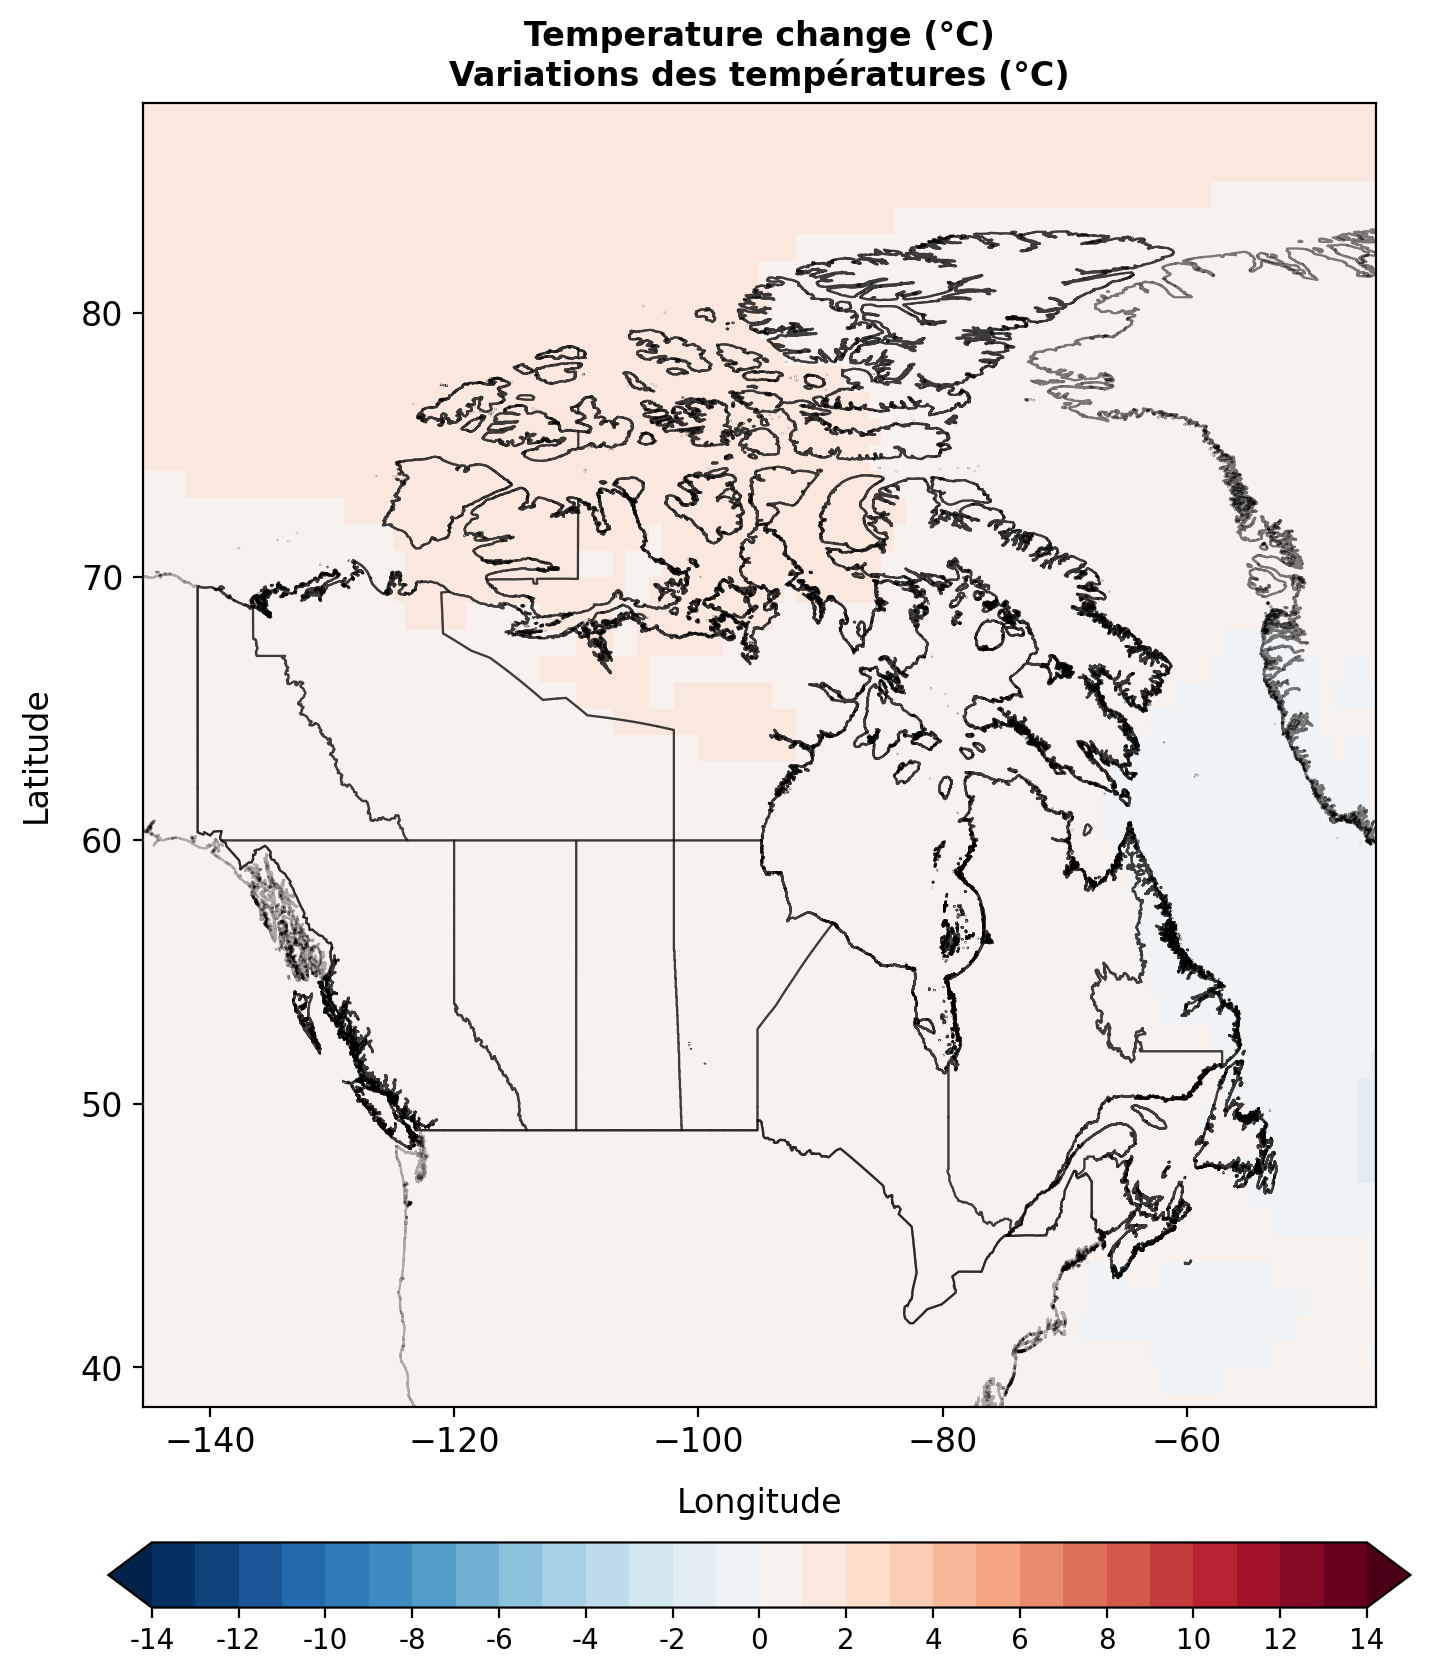
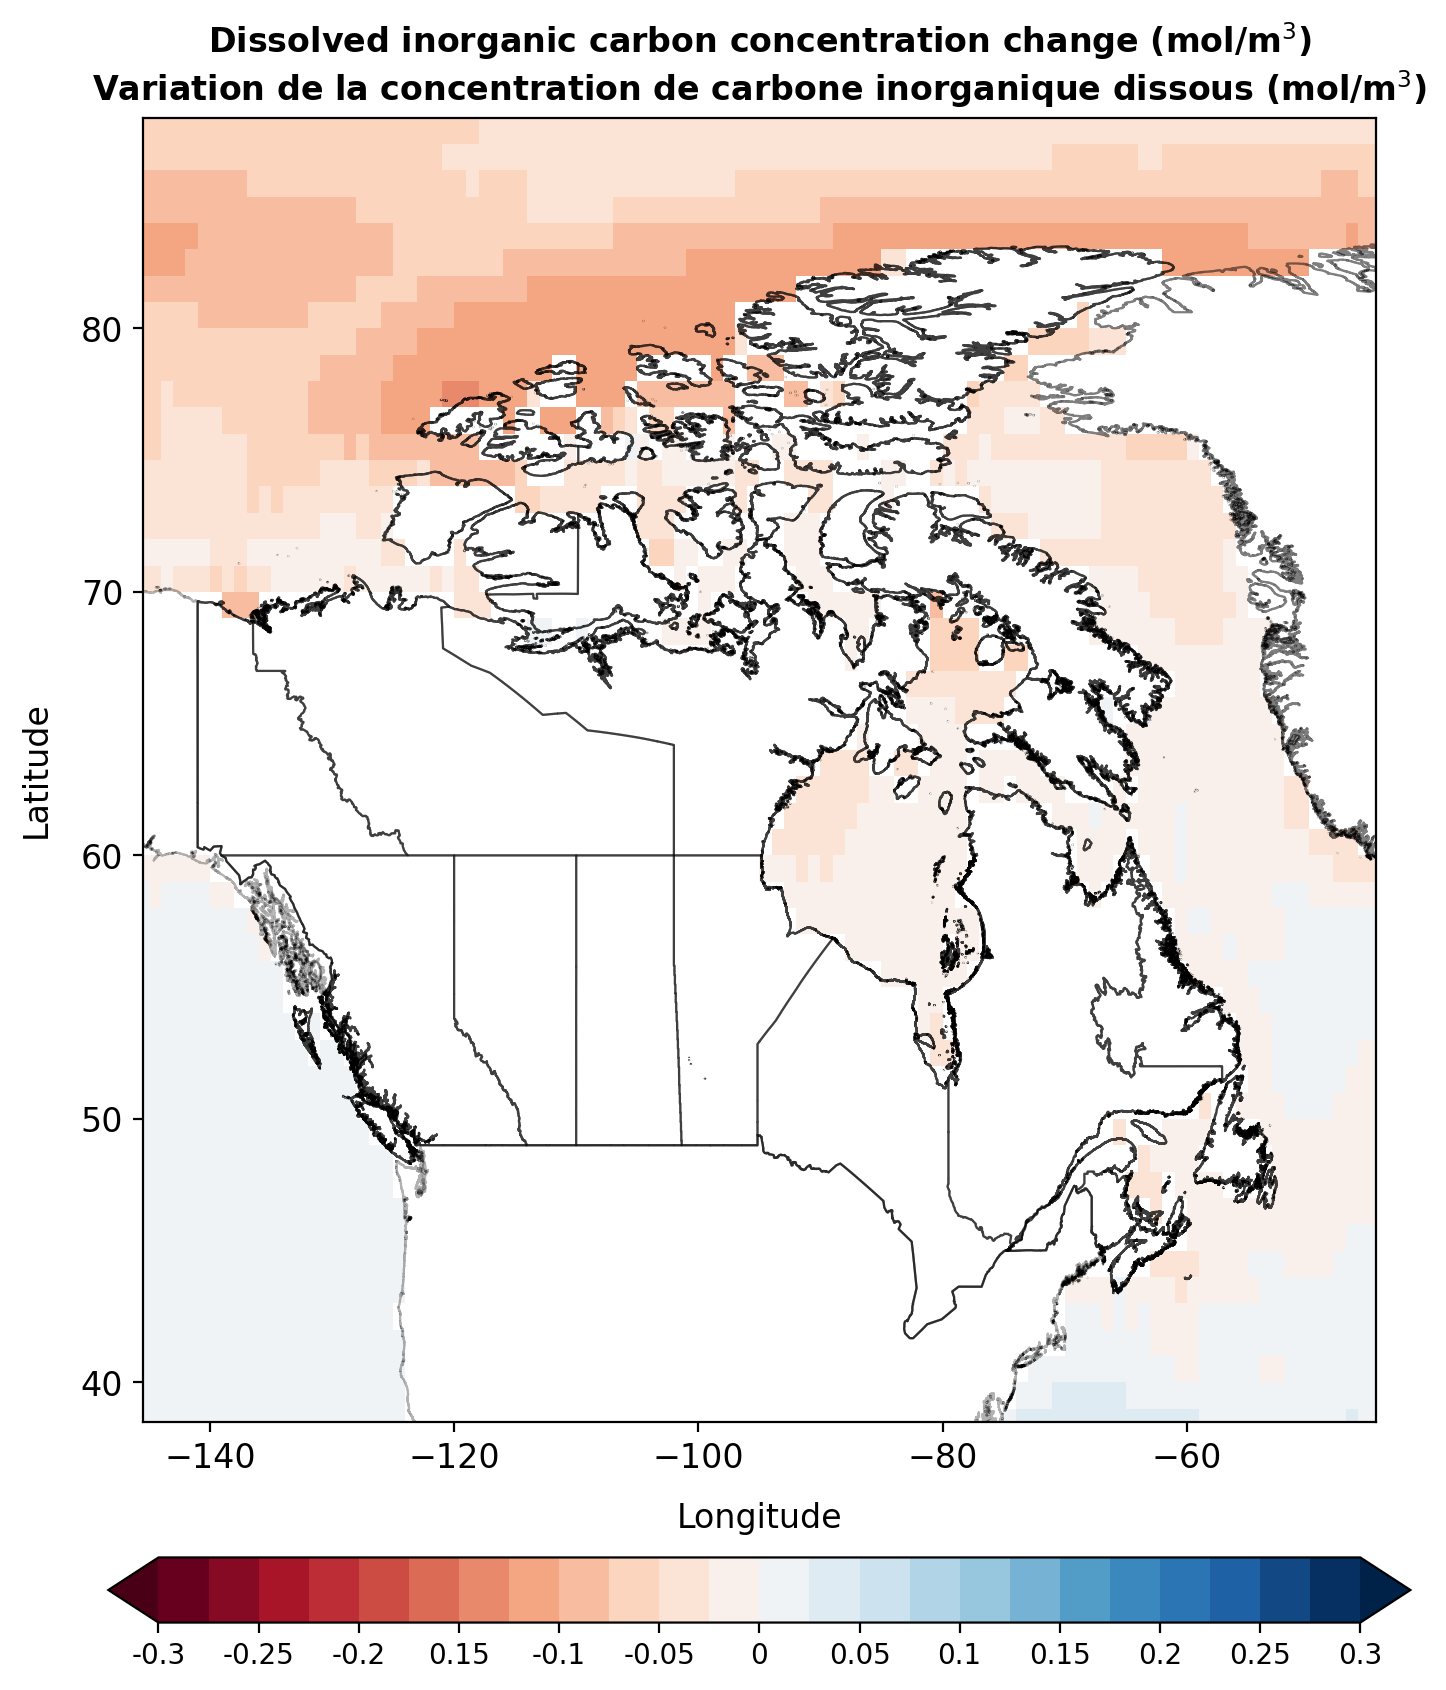
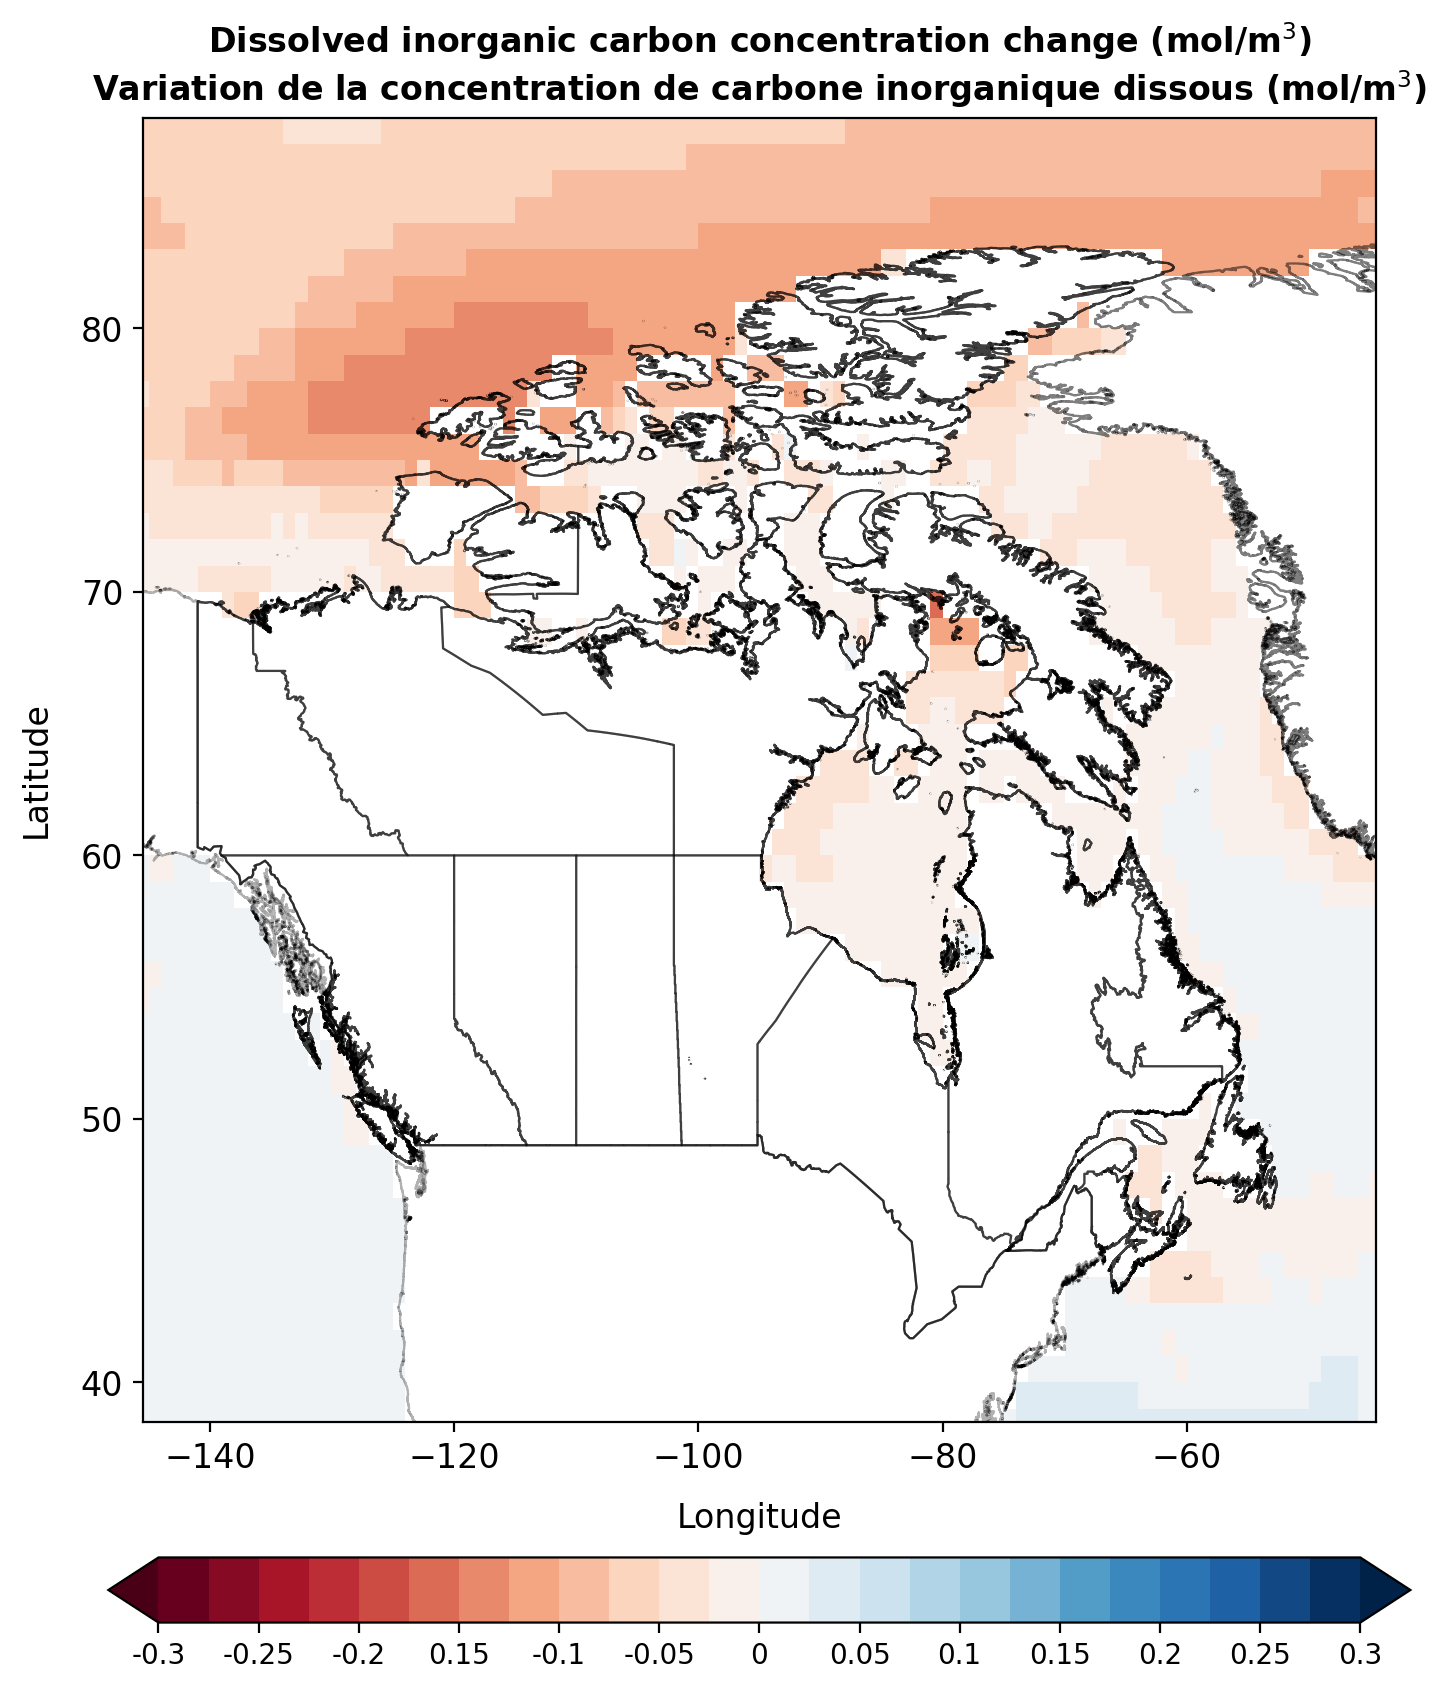
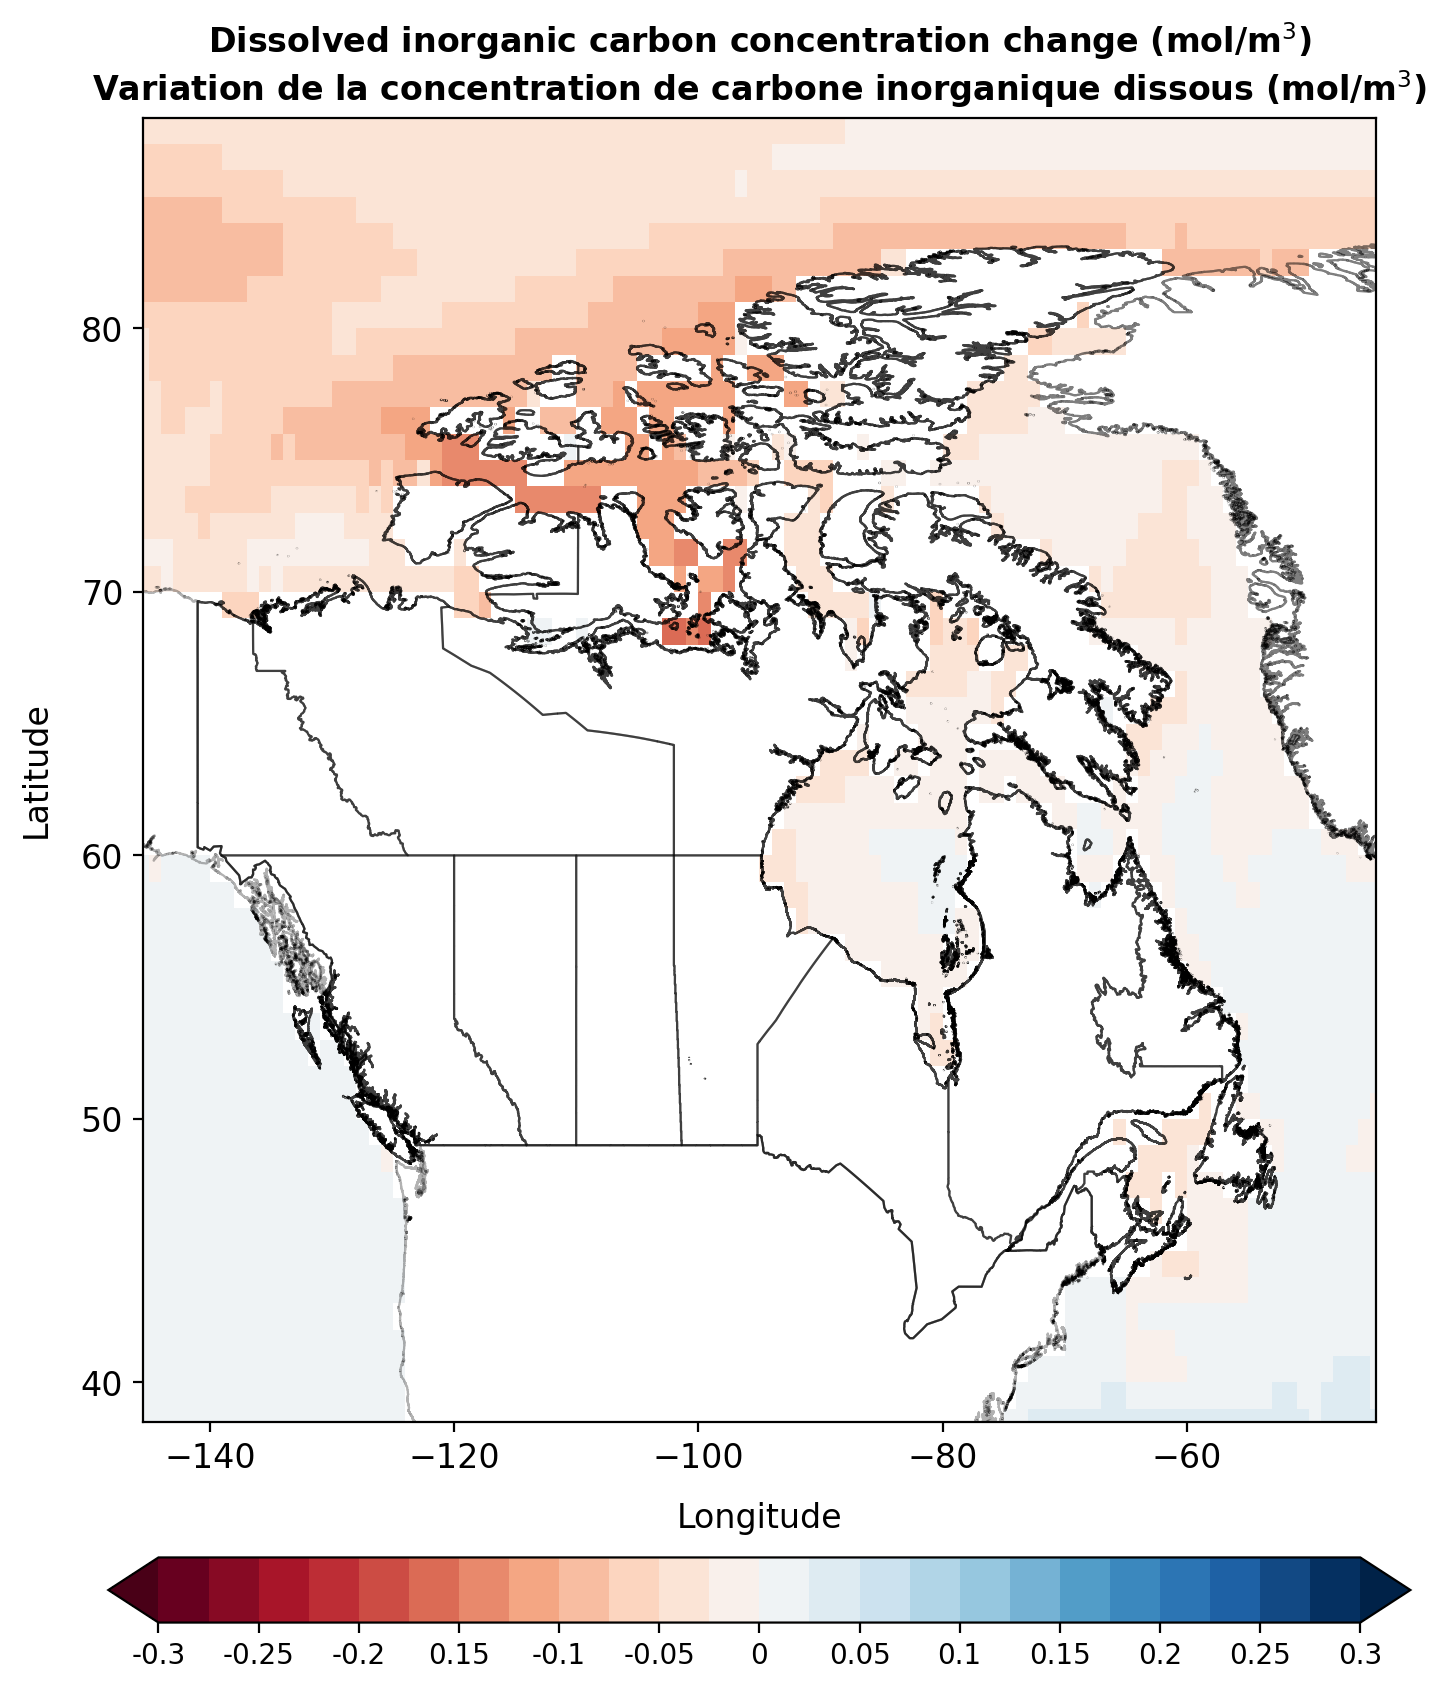
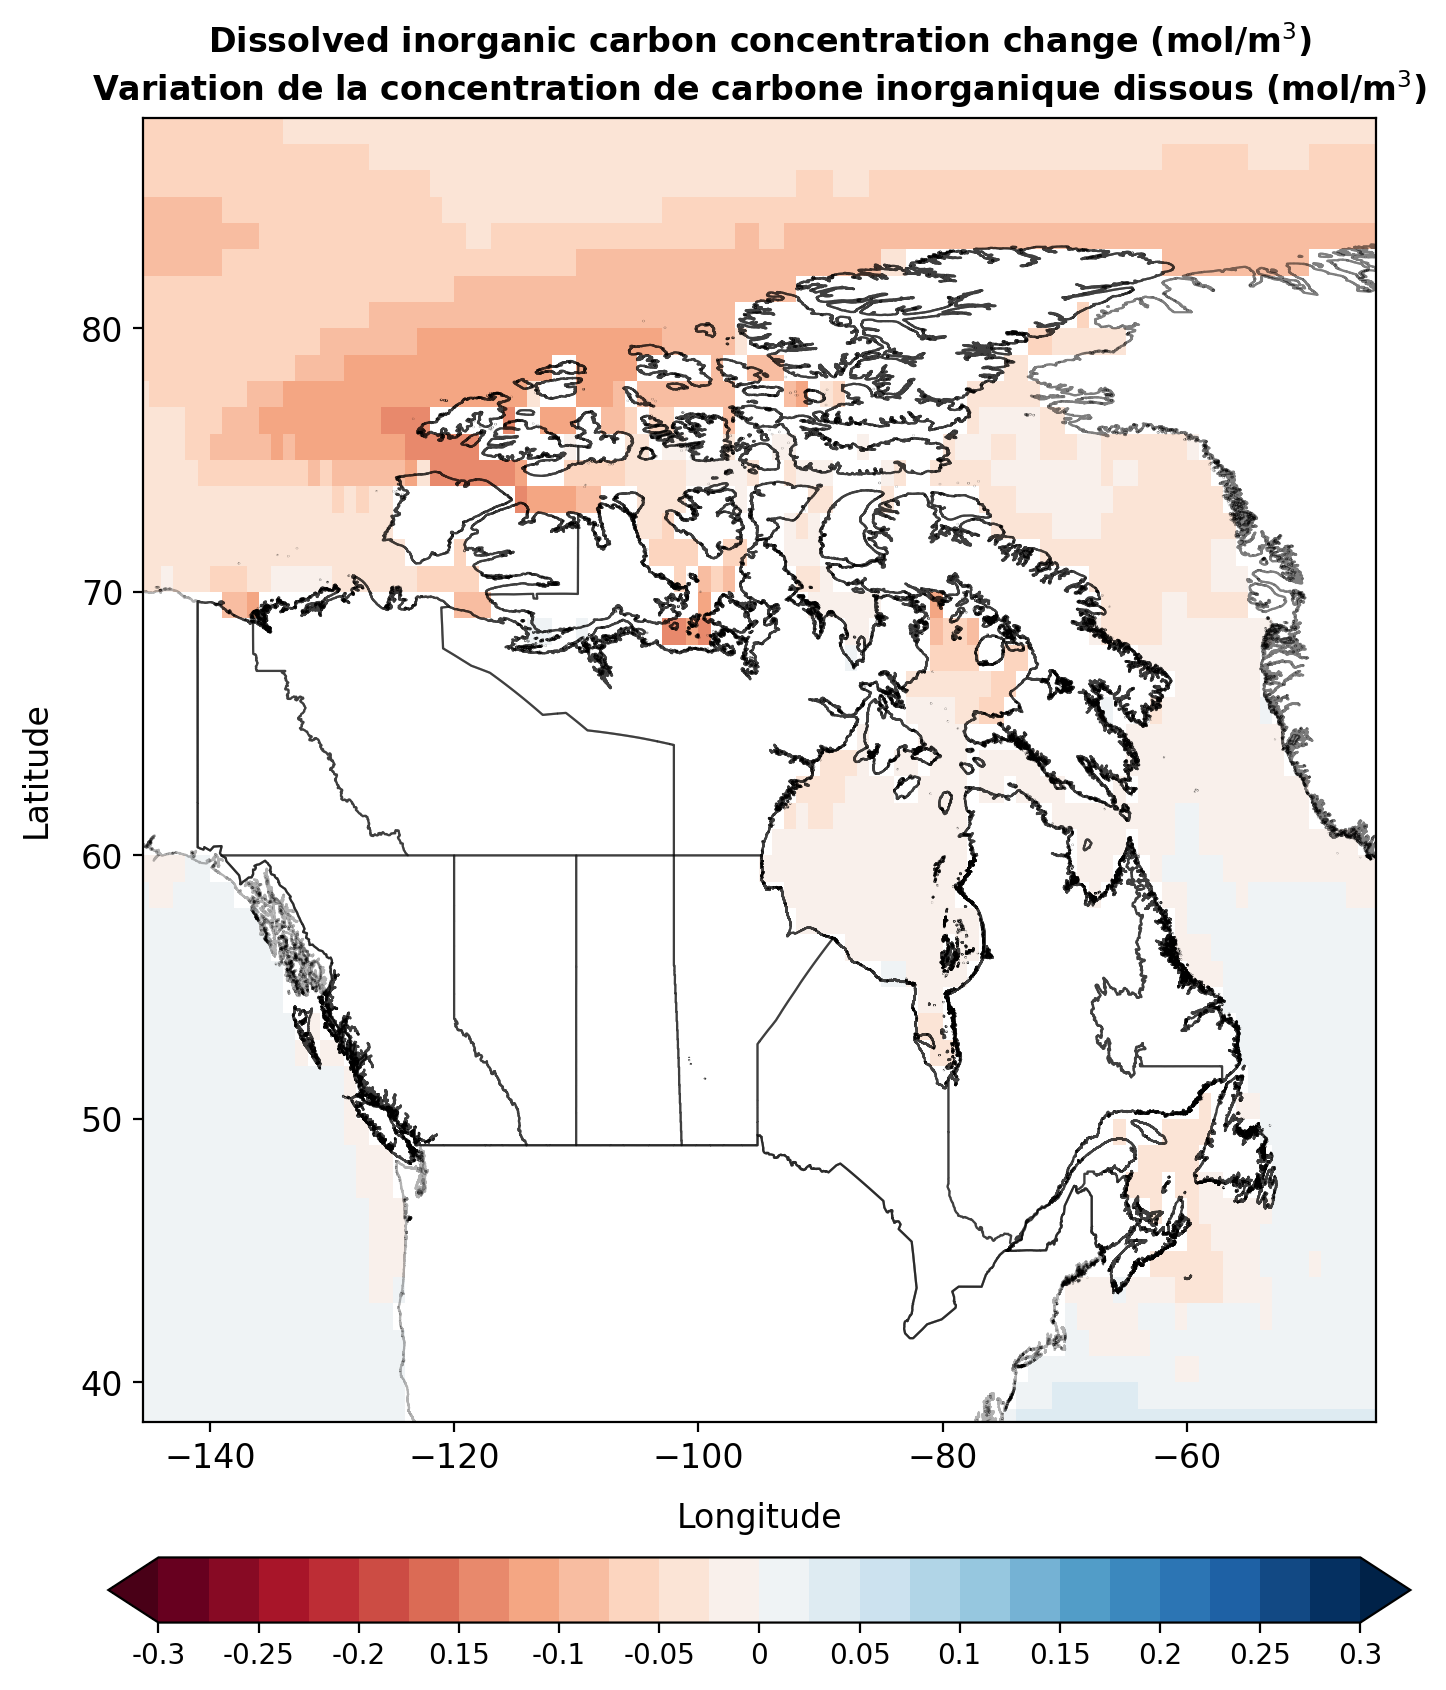
National maps and global datasets of projected changes in temperature, precipitation, near-surface wind speed, sea ice concentration, sea ice thickness, and snow depth averaged over 20 years for the near term (2021‑2040), mid term (2041‑2060 and 2061‑2080), and end of century (2081‑2100) are given, relative to a reference period of 1995‑2014. For each variable, the 5th, 25th, 50th, 75th, and 95th percentile of the CMIP6 ensemble distribution are provided for SSP1‑1.9, SSP1‑2.6, SSP2‑4.5, SSP3‑7.0, SSP4‑6.0, and SSP5‑8.5.
The sea ice concentration ensembles have been updated to include an additional model. This affects all users who downloaded these datasets prior to September 25 2024.
SSP1-1.9
SSP1-2.6

SSP2-4.5
SSP3-7.0
SSP4-6.0
SSP5-8.5
SSP1-2.6
SSP2-4.5
SSP3-7.0
SSP5-8.5
Time: 2021-2040
Tabular data
Tabular data
Provincial and national tabular data of projected changes in temperature, precipitation, and snow depth averaged over 20 years for the near term (2021‑2040), mid term (2041‑2060 and 2061‑2080), and end of century (2081‑2100) are given, relative to a reference period of 1995‑2014. For each variable, the 5th, 25th, 50th, 75th, and 95th percentile of the CMIP6 ensemble distribution are provided for SSP1‑1.9, SSP1‑2.6, SSP2‑4.5, SSP3‑7.0, SSP4‑6.0, and SSP5‑8.5. Note that temperature and precipitation datasets were updated in April 2023.
| SSP1-1.9 | |||||
|---|---|---|---|---|---|
| Regions |
5th percentile |
25th percentile |
50th percentile |
75th percentile |
95th percentile |
| Canada | 0 | 1.05 | 1.64 | 2.36 | 0 |
| Alberta | 0 | 0.91 | 1.18 | 1.47 | 0 |
| British Columbia | 0 | 0.85 | 1.22 | 1.46 | 0 |
| Manitoba | 0 | 1.08 | 1.36 | 1.88 | 0 |
| New Brunswick | 0 | 0.88 | 1.51 | 1.90 | 0 |
| Newfoundland & Labrador | 0 | 0.92 | 1.32 | 1.97 | 0 |
| Northwest Territories | 0 | 1.04 | 1.51 | 2.23 | 0 |
| Nova Scotia | 0 | 0.89 | 1.35 | 1.90 | 0 |
| Nunavut | 0 | 1.22 | 2.18 | 3.35 | 0 |
| Ontario | 0 | 0.98 | 1.51 | 1.96 | 0 |
| Prince Edward Island | 0 | 0.94 | 1.54 | 1.99 | 0 |
| Quebec | 0 | 0.92 | 1.56 | 2.27 | 0 |
| Saskatchewan | 0 | 1.08 | 1.31 | 1.62 | 0 |
| Yukon Territory | 0 | 0.89 | 1.22 | 1.46 | 0 |
Gridded data
Gridded data
Info:
- CMIP6 GCM output have been regridded onto a common 1x1 degree global grid
- CMIP6 GCM data is provided at a monthly time scale
- Please see the CMIP6 technical notes for more details on atmospheric and sea ice and ocean variables, and the multi-model ensemble overview for more information
- Original CMIP6 data can be accessed through the Earth System Grid Federation (ESGF) data portals
- In addition to these terms and conditions, individual model datasets are subject to the terms of use of the source organization
- Note that not every model in the drop-down list is available for all variables. Selecting a single variable may limit the models and SSP options available for download. Please see the atmospheric and sea ice variables model list and ocean variables model list for a summary of the models available for each variable and SSP combination, as well as those included in the CMIP6 ensembles.
- The precipitation gridded data multi-model mean ensembles have been updated. This affects all users who downloaded these datasets prior to September 18 2023.
- The sea ice concentration ensembles have been updated to include an additional model. This affects all users who downloaded these datasets prior to September 25 2024.